# MDA Adapter
The TISGraph-integrated TISGraph Adapter for MDAv2 grants access to data sets(usually time series), comments, statuses and images stored in MDA (see selecting the data source).
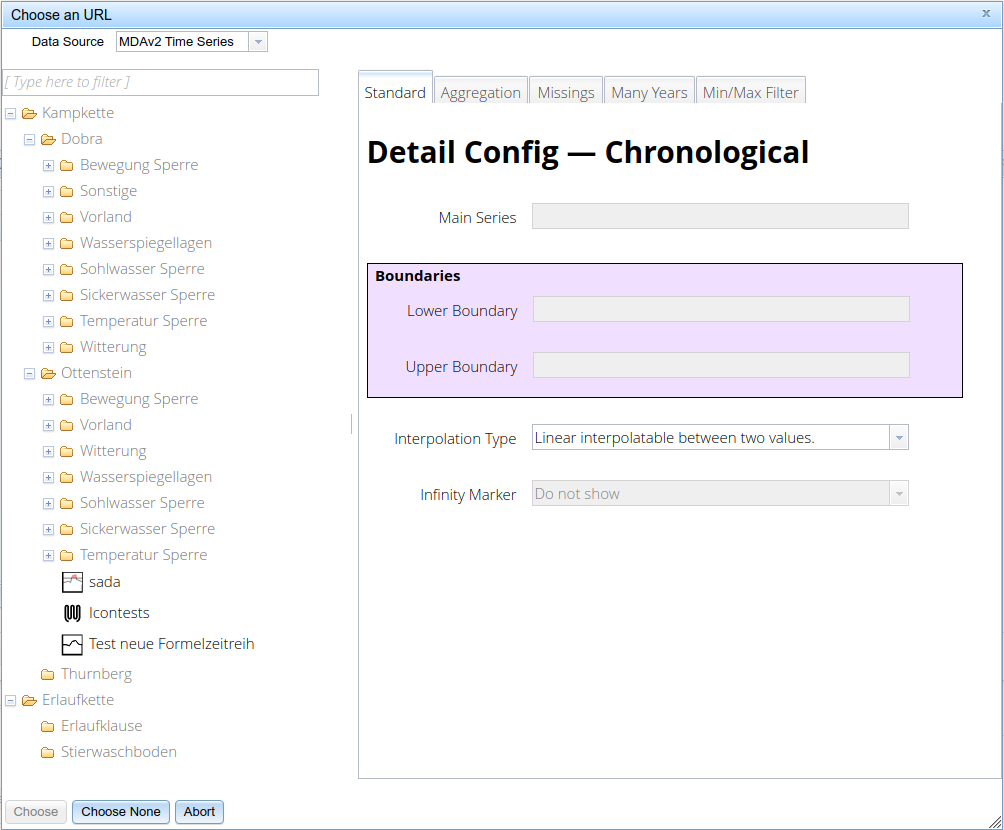
By selecting "MDAv2 Time Series" as the data source in the selection dialog, you will be shown an interface consisting of the following elements:
- Filter for the tree view
- Tree view for selecting time series (to the left)
- "Standard" - detail configuration for time series
- "Aggregation" - parsing data, potentially with pre-processing
- "Missings" - configuring behaviour for missing data
- "Many Years" - multi-year statistical values from reference date ranges (long term values
- "Min/Max Filter" - limit data to date/value ranges
All these configurations are stored in the TISGraph Data URL and shown in the "Datasets" tab.
# Standard
# Detail Config - Chronological
On this tab, you can configure the main time series as well as optionally boundary time series. Adding the latter will prompt MDA to also deliver dynamically generated status. Selection can be performed via the tree view, which can also be filtered for time series, parameters etc.
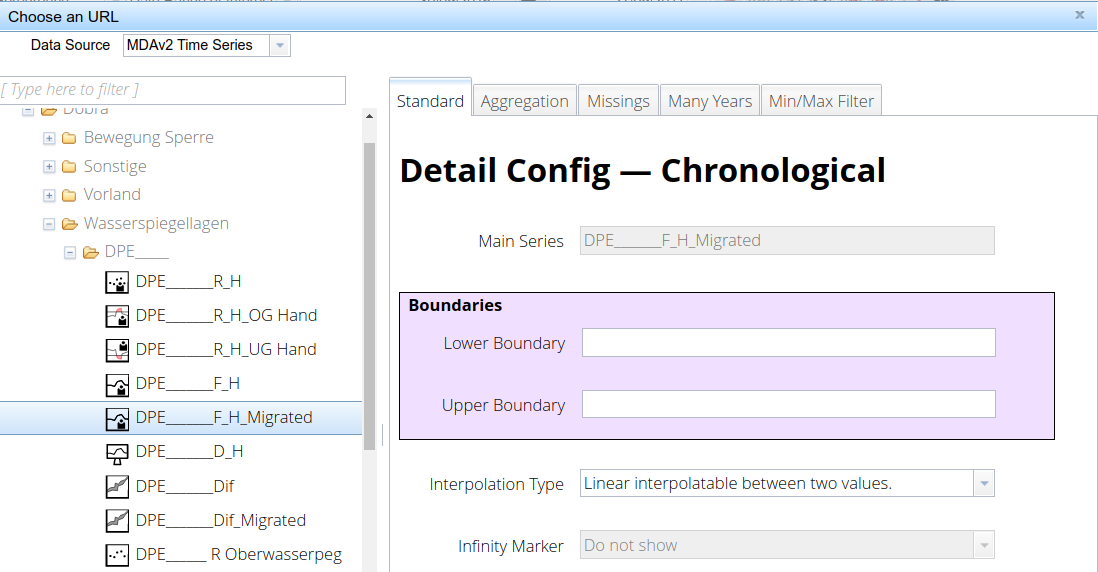
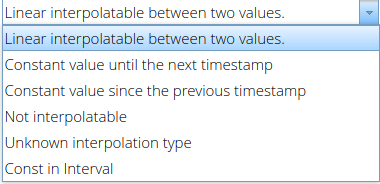
Interpolation Type is referring to the interpolation strategy to be used for this time series. Typical use cases for this setting are:
- High resolution momentary values: "Linear interpolatable between two values"
- High resolution average values: "Constant values until the next timestamp"
- Boundary values: "Constant values until the next timestamp"
"Detail Config - Chronological" is the same for time-based graphs, bar graphs, interval range graphics and tables.
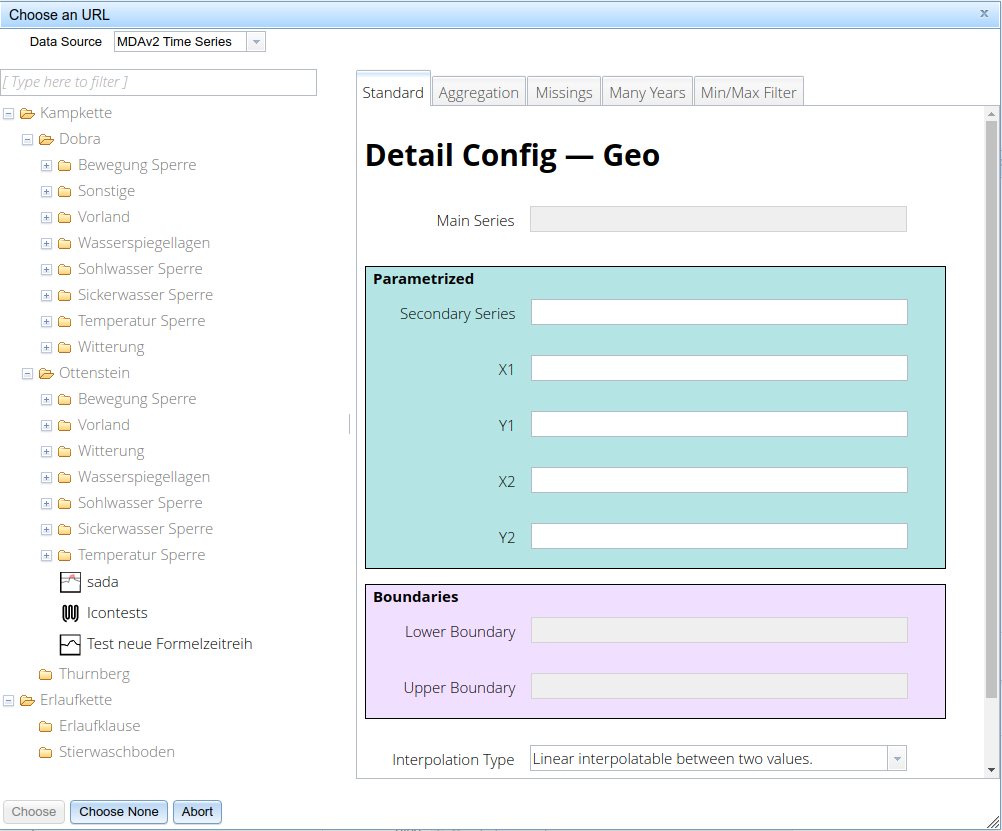
# Detail Config - Geo
TISGraph allows the creation of georeferenced graphics. A typical example for that is the display of water level measurements in front of a picture of a dam. When creating such a graphic, "Detail Config - Geo" will be shown in the "Standard" tab. It includes a Parametrized section, which allows configuring:
- a Secondary Series
- A X1 Coordinate, e.g. for vertical gauges
- X1/Y1 and X2/Y2 for e.g. tilted gauges
# Detail Config - Parametrized
For parametric graphs, an additional time series must be defined in the Parametrized section.
TIP
For min-max graphs, minimum and maximum can optionally be determined by aggregating from the main time series. Simply leave "Secondary Series" unconfigured in that case.

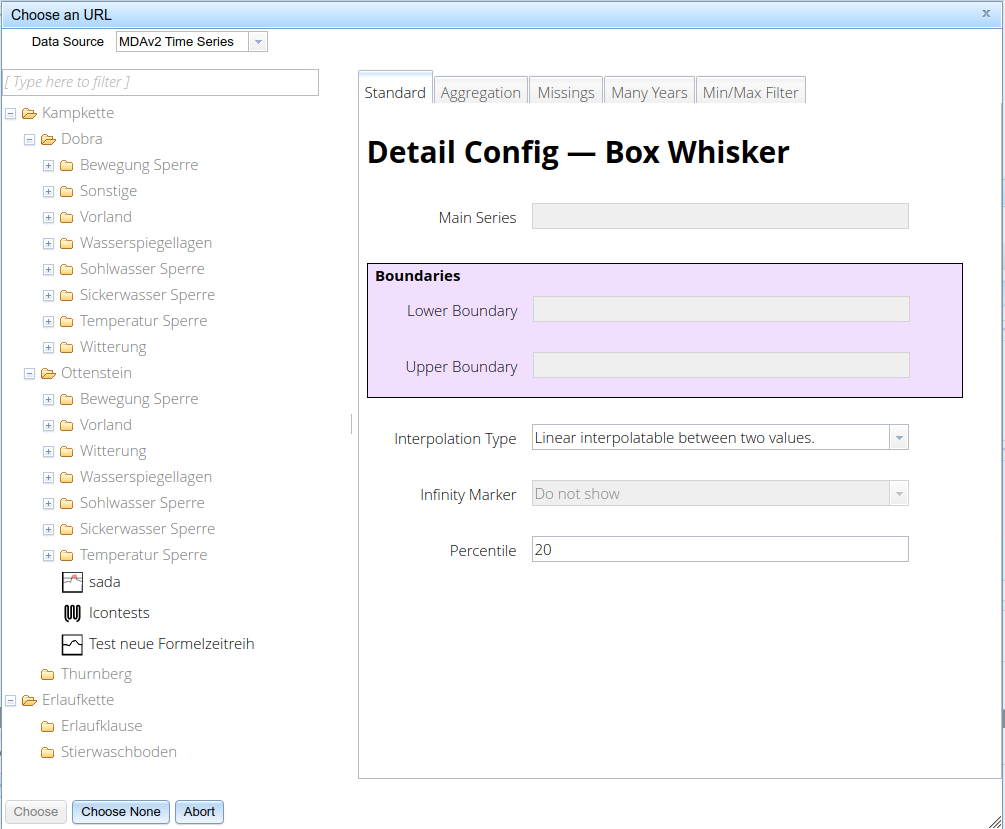
# Detail Config - Box-Whisker
In order to create a Box-Whisker graph, you will also have to enter a percentile value (default is 20):
# Aggregation
In contrast to the WISKI-Database, MDA contains no time series with statistical evaluations from measurement time series. Statistical evaluation can, however, be calculated via the TISGraph-MDA Adapter and configured in the "Aggregation" tab. In this example yearly maximum is calculated from weighted daily averages:
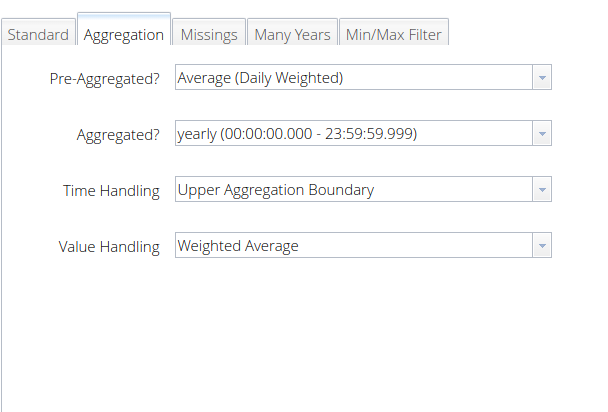
- In Pre-Aggregated? you can potentially specify pre-aggregations which are applied on a daily basis.
- Aggregated? specifies the interval over which the aggregation should be performed.
- In Time Handling, you can specify which timestamp should be assigned to the aggregated value. This has a direct effect on the display of the value in TISGraph reports: In the previous example we used Upper Aggregation Boundary in order to insert it at the end of each year (end of year being the upper aggregation boundary).
- Value Handling finally specifies, which statistical evaluation should be performed.
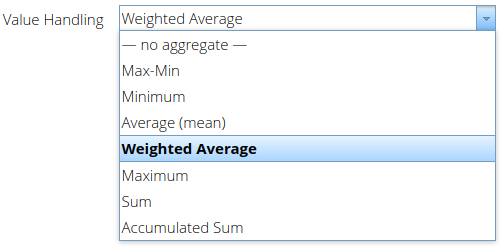
# Weighted Average
When taking into consideration values for a weighted average it is assumed that values are valid until the measurement of the next value. This is equivalent to the interpolation type "Constant value until the next timestamp". The interval between two values is used to determine the first value's weight.
Gaps in the date range are considered to be missing in the timeline and are ignored for weighing and calculation. E.g., if a daily weighted average is to be ascertained, but there is a gap of 2 hours in the graph, the average is instead calculated on the remaining 22 hours.
# Aggregation of Precipitation
Evaluation of rainfall can be done over different intervals. The TISGraph-MDA adapter currently has intervals 0:00 - 0:00 and 07:00 - 07:00 implemented. In "Pre-aggregated?", the 7 AM interval is currently only defined for maximum and sum aggregations.
TIP
Currently, when evaluating the 7 AM interval, the interval considered is actually from 7 AM until the first measurement after the following day's 7 AM. This implementation exists for those precipitation data sources which store the last measured value a few seconds after 7 AM instead.
More evaluation strategies for precipitation sensors can be implemented.
# Missings
In the "Missings" tab, you can configure the behaviour in response to missing and invalid values.
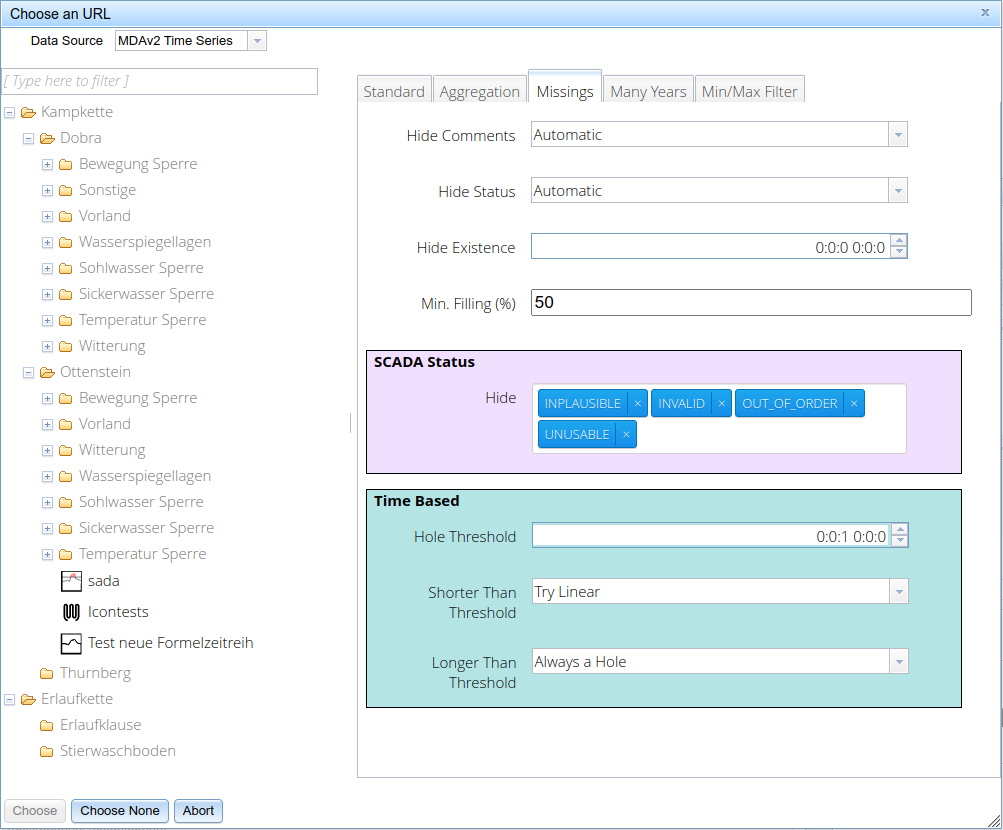
Hide Comments gibt an, ob eine Lückenbehandlung vorgenommen wird und wenn ja wie die weitere Vorgehensweise dabei aussieht.
Hide Status defines if data status is filtered and if yes, what approach is taken.
Hide Existence specifies the duration, after which a period of receiving no new values is considered to be a "hole".
Min. Filling (%) is only relevant for value aggregations. If an aggregation unit (e.g. day in daily weighted average) has a lower percentage of non-hole duration than this value, then the unit as a whole is considered to be a hole.
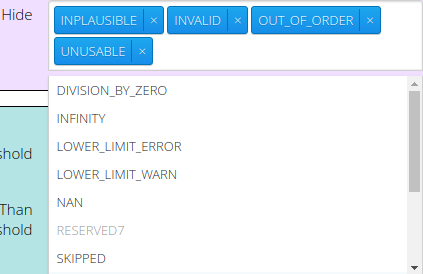
SCADA Status: status which are to be filtered can be added by clicking on the combo box and selecting a value from the drop down. Values with these SCADA status are considered to be empty instead.
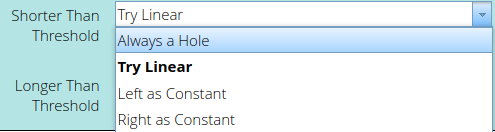
Time Based: In this section you can define the minimum length of what is considered to be a hole. You can define what action to take if the threshold is exceeded or undercut respectively. The options available consist of treating it as a hole, fill the gap by linear interpolation as well as filling it with the closest previous or subsequent value.
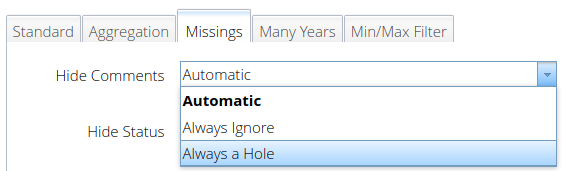
# Hole Management Overview
The following table provides an overview how holes are being dealt with by different configurations for "Hide Comments" and "Hide Status".
| Choice | Hide Comments | Hide Status |
|---|---|---|
| Requirement | *Occurence of faulty value according to "Hide Existence" and "Min. Filling (%)" configuration | Definierte Status treten auf |
| Automatic | Holes are dealt with according to the configuration under "Time Based" | Value is hidden and hole handling occurs according to "Time Based". |
| Always Ignore | No Hole Assignment | Data status is not evaluated. |
| Always a hole | Any missing values are considered holes. | Value is set as hidden and a hole is inserted. |
# Many Years
Under the "Many Years" tab, you are given the option to aggregate daily statistics over pre-defined reference date ranges, e.g. the daily average of air temperature in the time period 1995 - 2015.
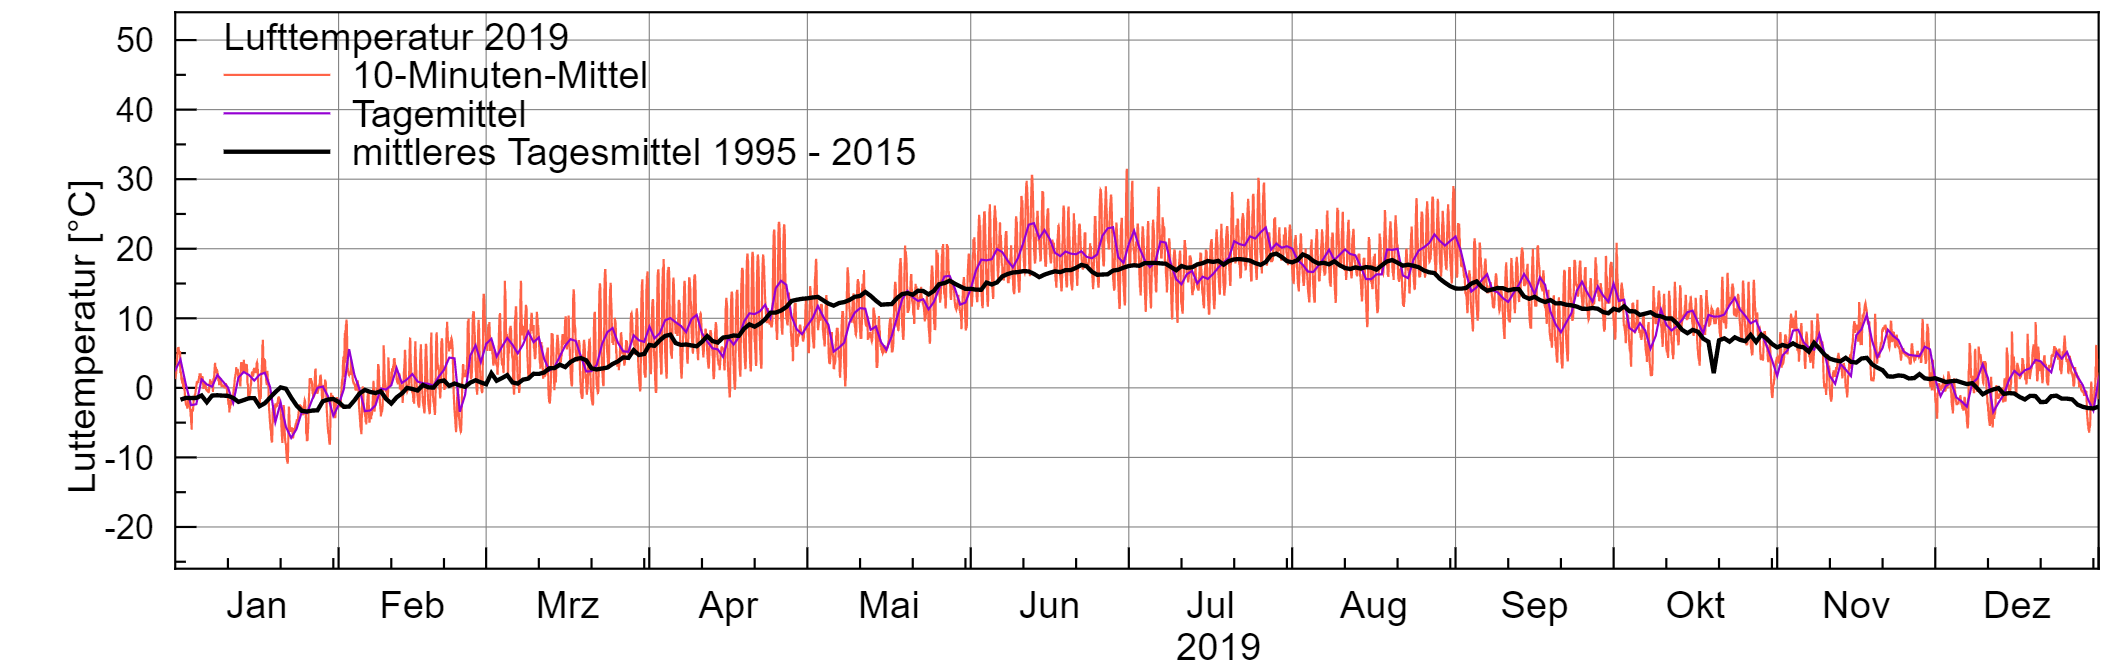
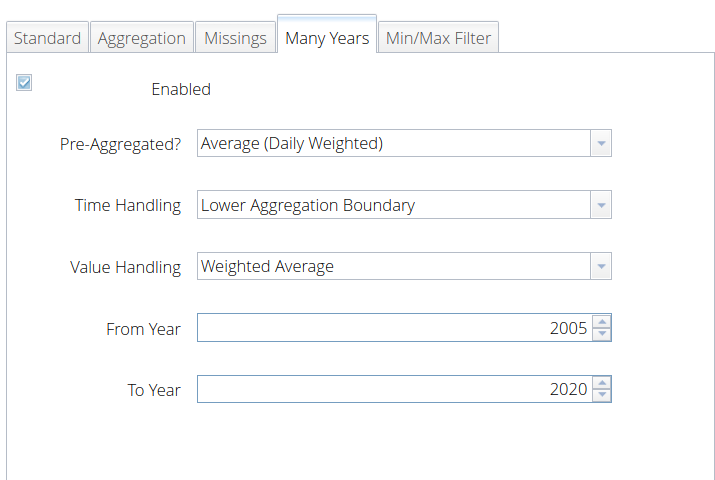
The reference period stays fixed to the values set by "From Year" and "To Year". It is independent from the observation range of the TISGraph report. Should the reference period be changed, the "From Year" and "To Year" values need to be adjusted.
TIP
Potential development options for this feature could be:
- Evaluation on a weekly or hourly basis.
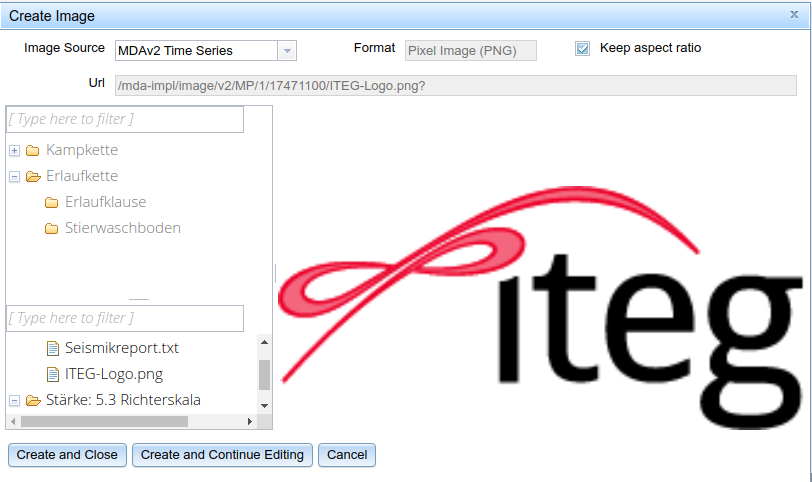
# Inserting images from MDA
When inserting an image into a TISGraph report and selecting MDAv2 TISGraph Adapter as the image source, you will be presented with the typical MDA tree pane in order to select the image source within it. You can use the filter to help find it easier. If a valid source is selected, the file names of the images are displayed in the lower segment of the tree view, along with a preview to the right.