# Creating Tables
Tables can be used to organize dynamically delivered data in table form. This also includes missing data, in the following (german) table denoted as "n.v.":

# Configuring Tables
As per usual for data objects, tables can be configured in their respective edit dialog. One thing to be mindful of is that output of time series data is configured in the dialog for each cell individually, which is being replaced by one cell for each value in the table itself. How many and what kinds of cells are being outputted depends on the table type, data set and the observation range.

# Cell Types
The following cell types are available:
- "Static Text" simply outputs the unchanged text configured in the rich text editor.
- "Dynamic Text" outputs text dynamically gathered from the data source.
- "Time-based Data" outputs time series data loaded from the data source. The date range outputted is either explicitly set to a static range or determined by the document's observation range.
- "Associated Timestamp" outputs the data's time stamp. You can freely adjust the time zone and date format used for the output.
# Foldout of Data Cells
While the first two listed cell types conform to exactly one cell in the generated table, the two latter ones generate as many cells as needed to depict the data within the given range. On a table level, you can configure in which direction (left, right, down, up) these kinds of cells are being folded out in.
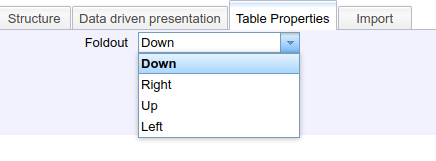
Selecting "right" would, for instance, result in the following layout:

When folding out multiple cells, including a timestamp cell, values in rows/columns will correspond to that timestamp and for each timestamp value in the dataset, one row/column is being generated. In case the timestamp data is not equivalent amongst datasets, each timestamp occurrence in any data set will still generate the row/cell and mark the cell with missing data for that timestamp.

In this example, an incomplete data point was delivered on 16/01/2013), missing the middle column (work hours). Alternatively, it's also possible to set cells as primary in order to demand data sets to have that field set. If the second column would be set as primary, the second row would simply be omitted in this case.
# Primary and Secondary

- Primary Dataset: Defines the time grid (Every entry in this set has a timestamp
- Secondary Datasets: Do not define the time grid. Only show up if delivered for the same timestamp of a primary dataset's value.
# Timestamp Precision
It is possible to alter the timestamps delivered by a table's data source to have a specific date-time precision (selecting "constant" will change all dates to 01/01/1970)

This can be useful for bundling together data of a specific time interval. In the following example, two sensors frequently send data on the same day, but at different times:

By setting the timestamp precision to daily, these two values are bundled instead. Please note that the time of day is set to 00:00:00 for each entry since it is disregarded (and lost in the process)

# Changing Cell Properties
You can select one or multiple cells in the edit dialog (multi select is possible by pressing and holding the CTRL while left clicking).
In the "Selected Cells" segment you can configure the properties of all cells regardless of type. Changing a value here will set it for all cells simultaneously. Empty value fields indicate that the value is not equivalent for all cells (not that it is empty for all of them). This is most useful for setting style options such as font size globally.
The "Focussed Cell of type X" tab on the other hand lets you configure individual properties of a cell. This could be static text for instance, or the TISGraph Data URL of a cell of type Time-based Data.
# Table Structure
The toolbar above the table preview offers various options to modify the table structure and cell borders. It also provides functionality to alter the rendering of information inside the preview.

For instance, you can add or remove rows and columns, combine cells together or separate them again. This might be helpful for headers or data cells which are meant to span multiple cells.


The icons in the right-most part of the toolbar ("Show details?") can be toggled to make the preview include more extensive information about the dataset, as well as illustrate the foldout process in the case of more complex table layouts.
# Cell Borders
For cell borders, there is a distinction to be made between inner and outer cell borders. Inner borders exist between folded out cells of the same dataset, while outer borders exist between cells which are not folded out. Inner borders always use the same stroke style. The following screenshot has outer borders set to black, while inner borders are grey:
Both kinds of borders can be configured via the toolbar. In the case of outer borders, a dropdown exist to affect all currently selected cells, as well as a tool to change select individual borders.
# Difference Function between Fields
With this configuration, the cell outputs the difference between select two other fields for the same timestamp. Logically, this can only contain a value if both values exist for the same timestamp.
# Data Point Dependent Display Parameters in Tables
TISGraph has some functionality for data driven presentation, i.e. the depiction of data points depending on certain properties of said data points, which also includes tables. See the relevant chapter for more details.