# Time Based Protocols
See also:
# Daily Protocols Overview
# Pre-selection
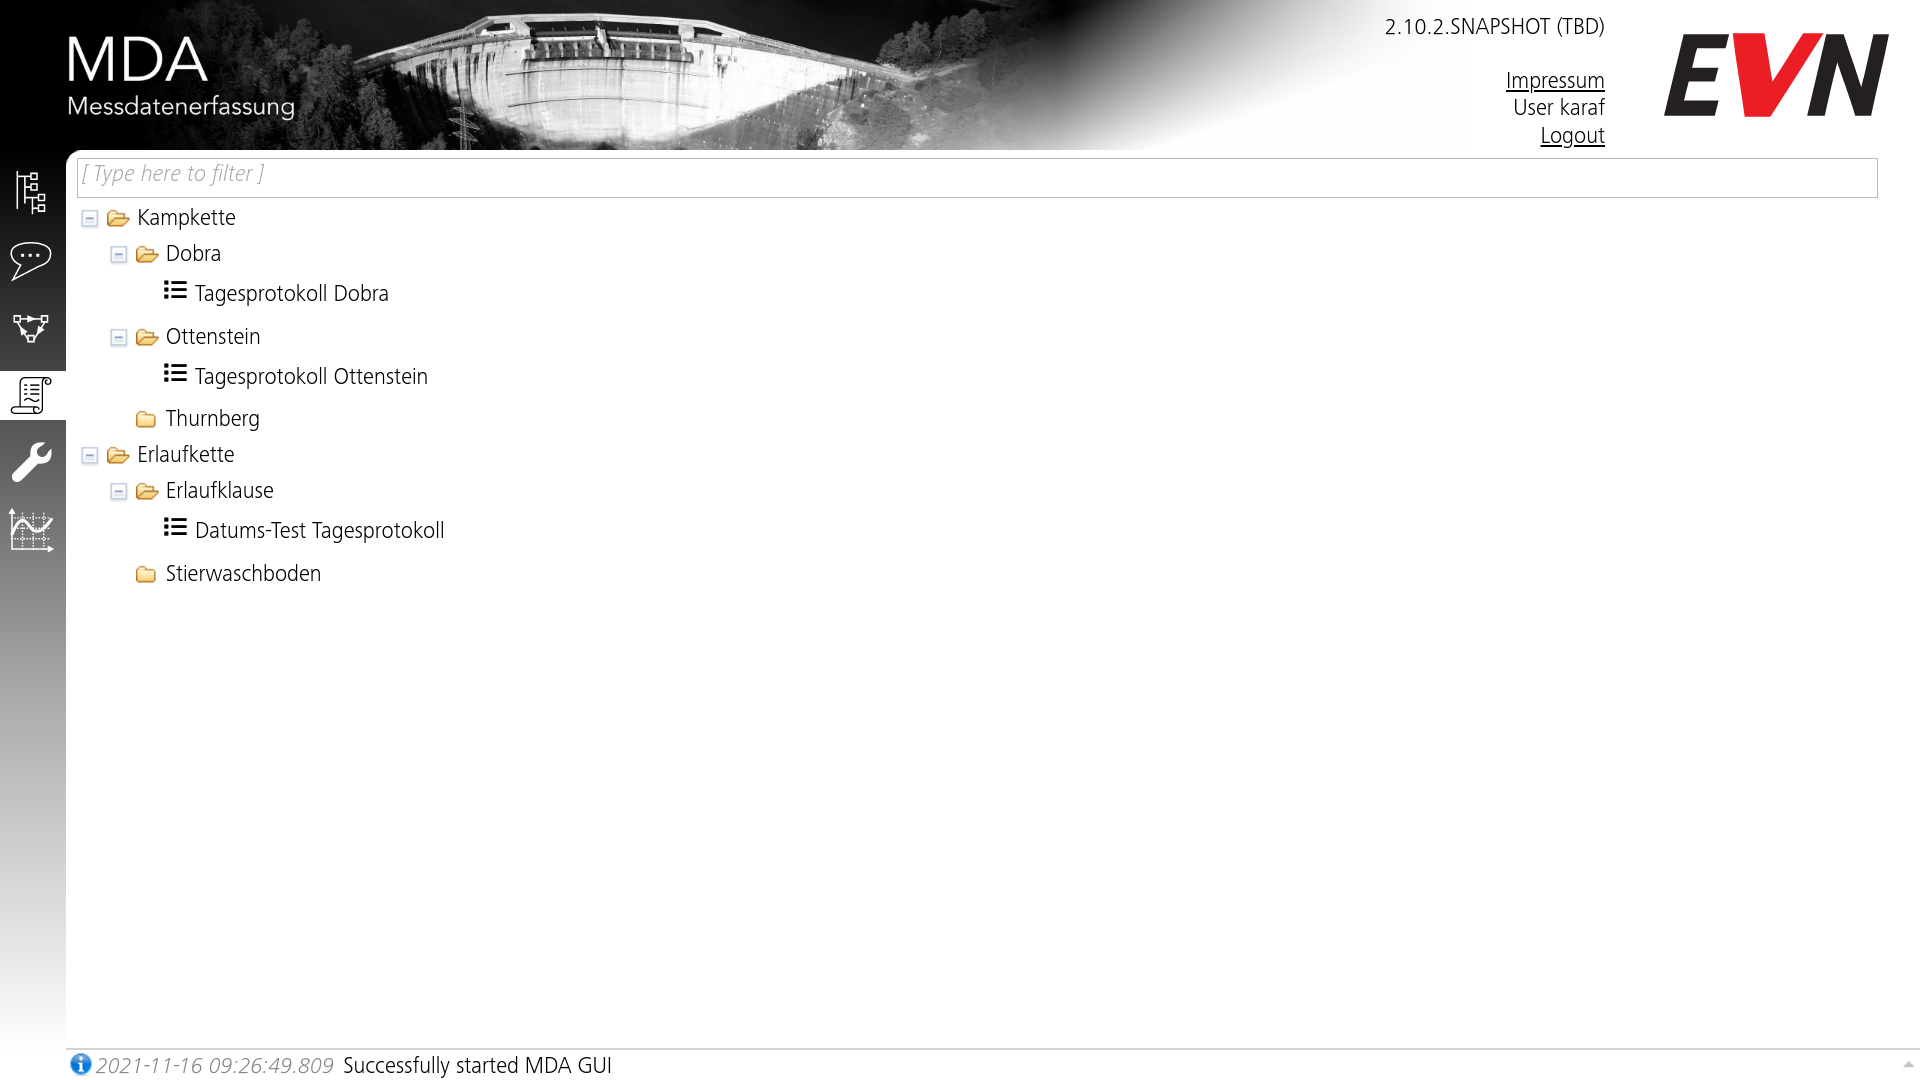
This page shows specifically all measure points which have protocol definitions defined for them, as well as those definitions.
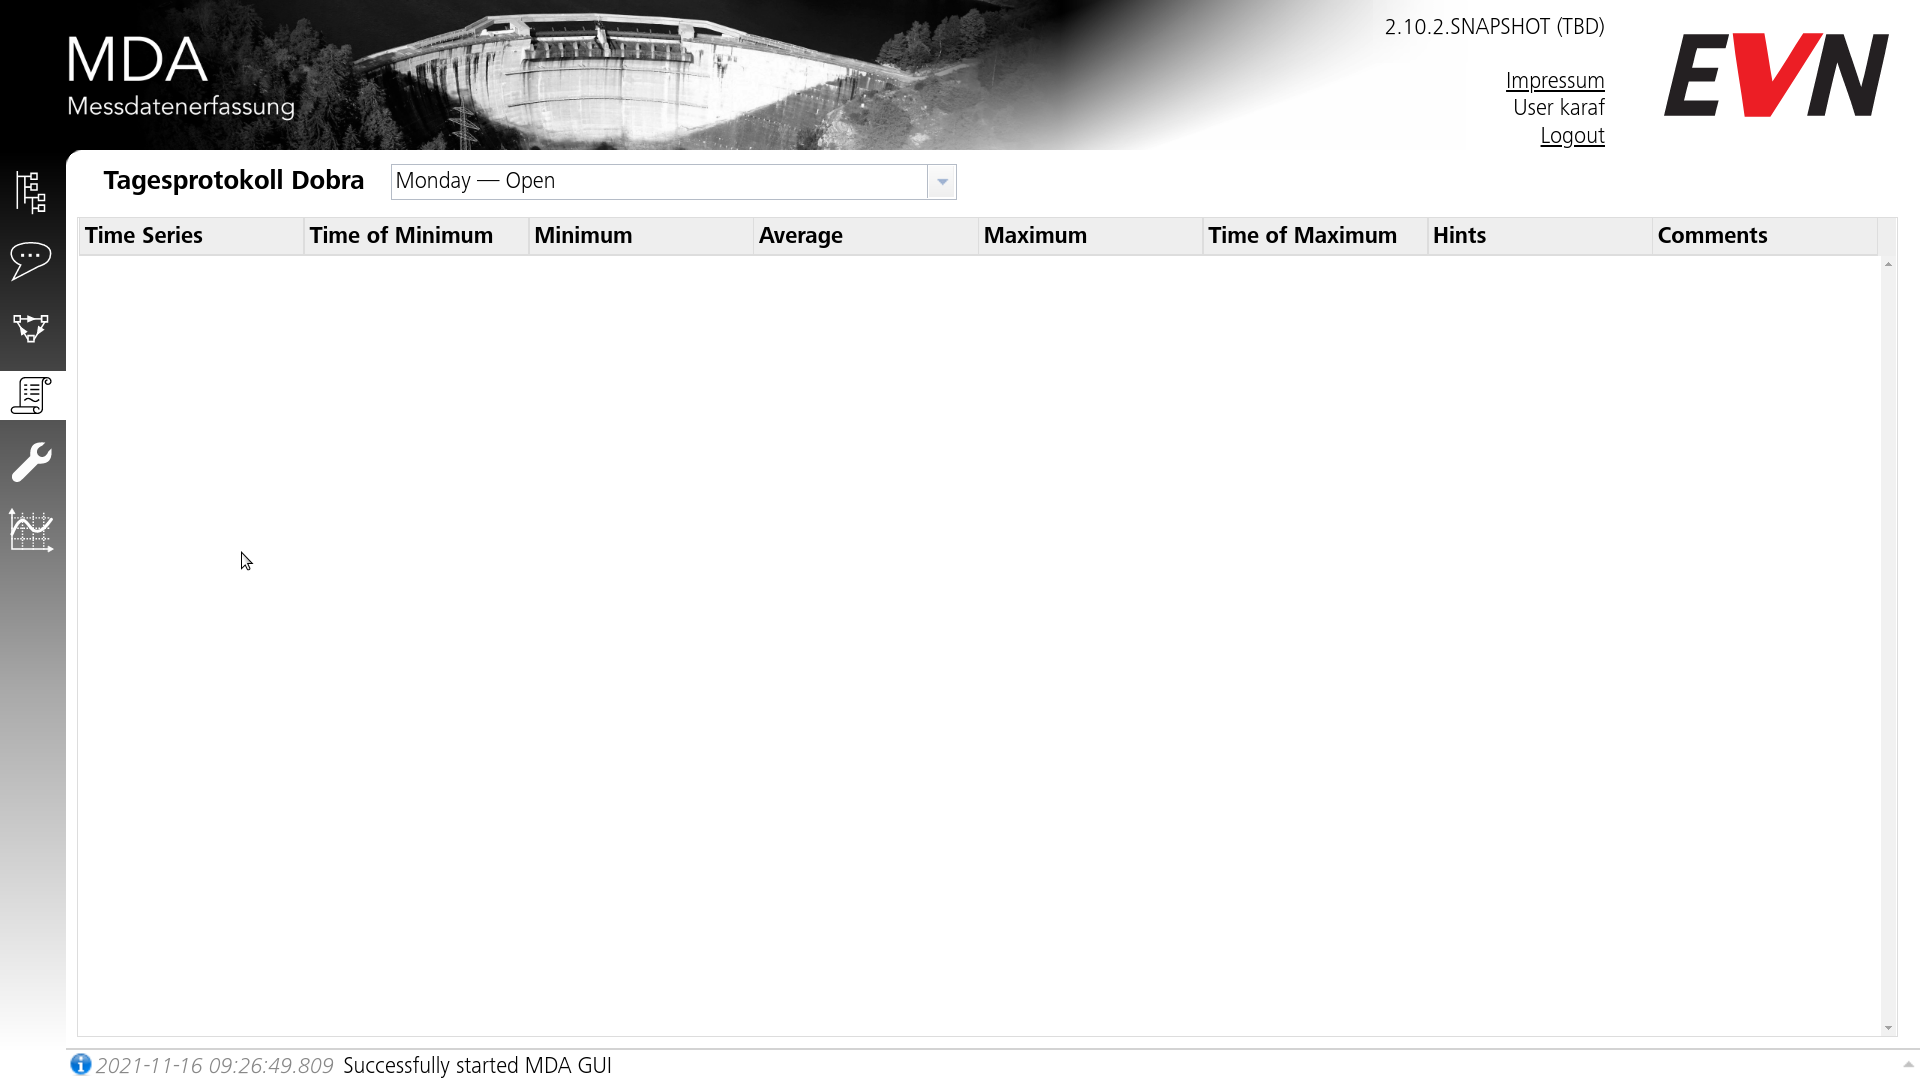
# Post-selection
By clicking on one of the definitions, the tree minimizes as a XHR request is sent to retrieve the protocol for the current day:
# Time Dropdown
The drop down on top offers a few pre-defined shortcuts for specific use-cases:
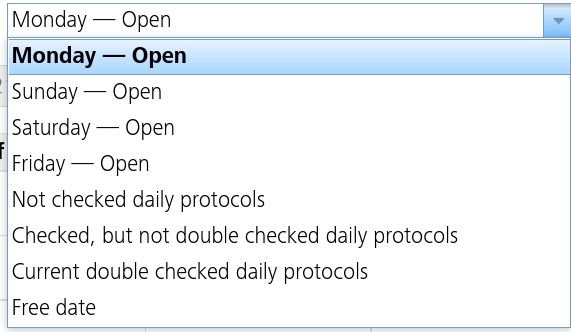
- The last four days are added to this drop-down, alongside a status of whether they're still "open" or already "checked". Please be aware that "checked" in this case means double-checked, since "open" means there is still work to do.
- Additionally, there are also potentially interesting filters like unchecked protocols. You will still have to specify a day to show the filtered results for.
- Lastly, you can manually select a date using the "Free date" option.
Selecting any of these options will asynchronously reload the page as the new filter is applied.
# Post-loading
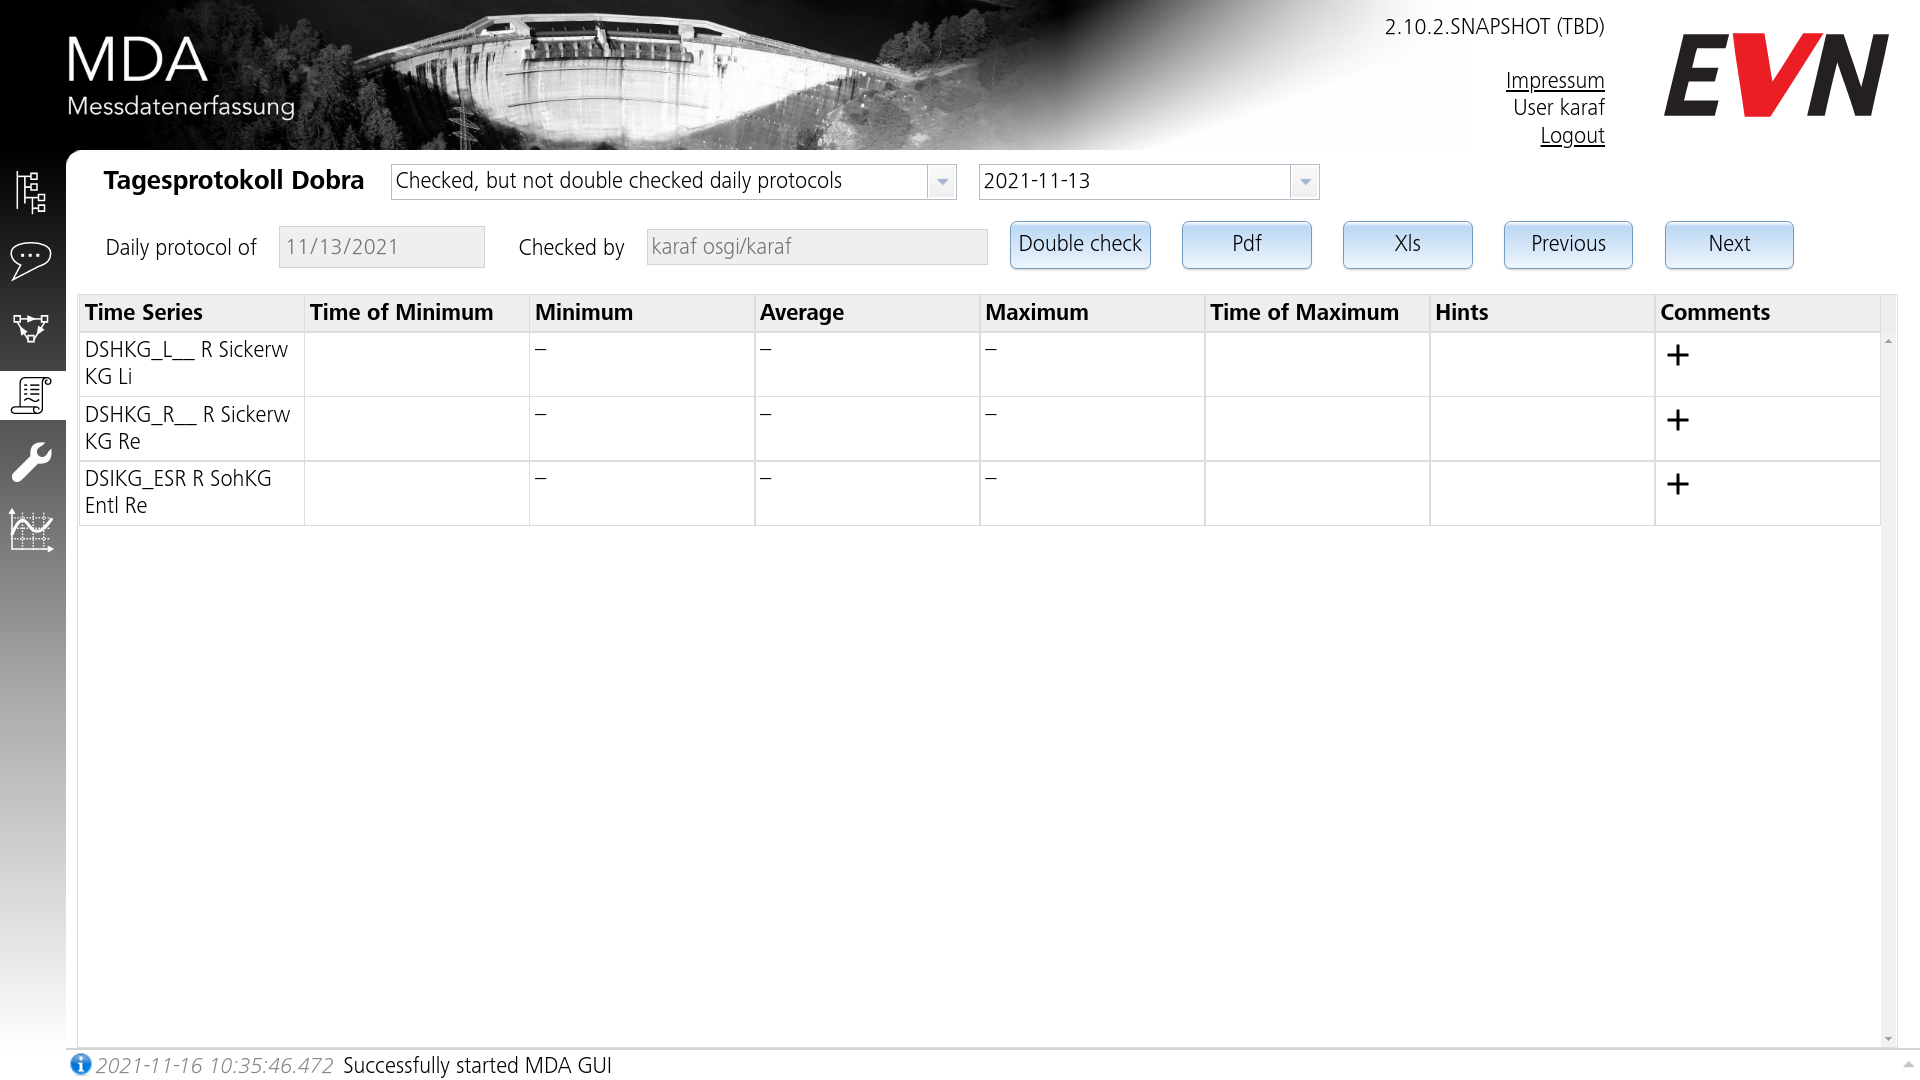
After the request was processed, information about your selected protocol will be shown, alongside a list of time series that were measured. The list shows a few statistical values regarding the measured values, such as minimum or average.
Clicking on any of the rows will open the TISGraph-Chart of the selected time series in a seperate window. This can be helpful to see further details on the relevant time series.
You can also directly create comments here, and the relevant time series and measure point will be automatically linked in the comment dialog.
# Buttons
The button interface gives you the same functionality as the [measure round protocol dialog](./30-measure-rounds.md#protocol dialog), namely:
- Check/Double Check: opens the protocol check dialog. See below for more details.
- PDF: Automatically downloads the protocol in PDF format.
- XLS: Automatically downloads the protocol in XLS (spreadsheet) format.
- Previous/Next: Selects the next/previous time series in the list. Behaves the same as if the TS was clicked manually (the TISGraph Chart will open).
# Hints
The "Hints" column will be filled in one of several cases:
- SCADA reported a status which hints at an anomaly. The statuses being reported are: "outOfOrder", "unusable", "implausible", "upperLimitExceeded", "lowerLimitExceeded".
- The max-min max-min-limit is exceeded.
- One of the time series part of the protocol is marked as deactivated and should be removed from the protocol definition.
In the case of a deactivated time series, the row containing that TS will also be coloured yellow.
# Double-check button
Upon having checked a protocol, the "Check" button will disappear and be replaced by information about who performed the first check and a double-check button:

Similarly, after the double check the button is replaced by information of who performed the double-check:

# Protocol Check Popup
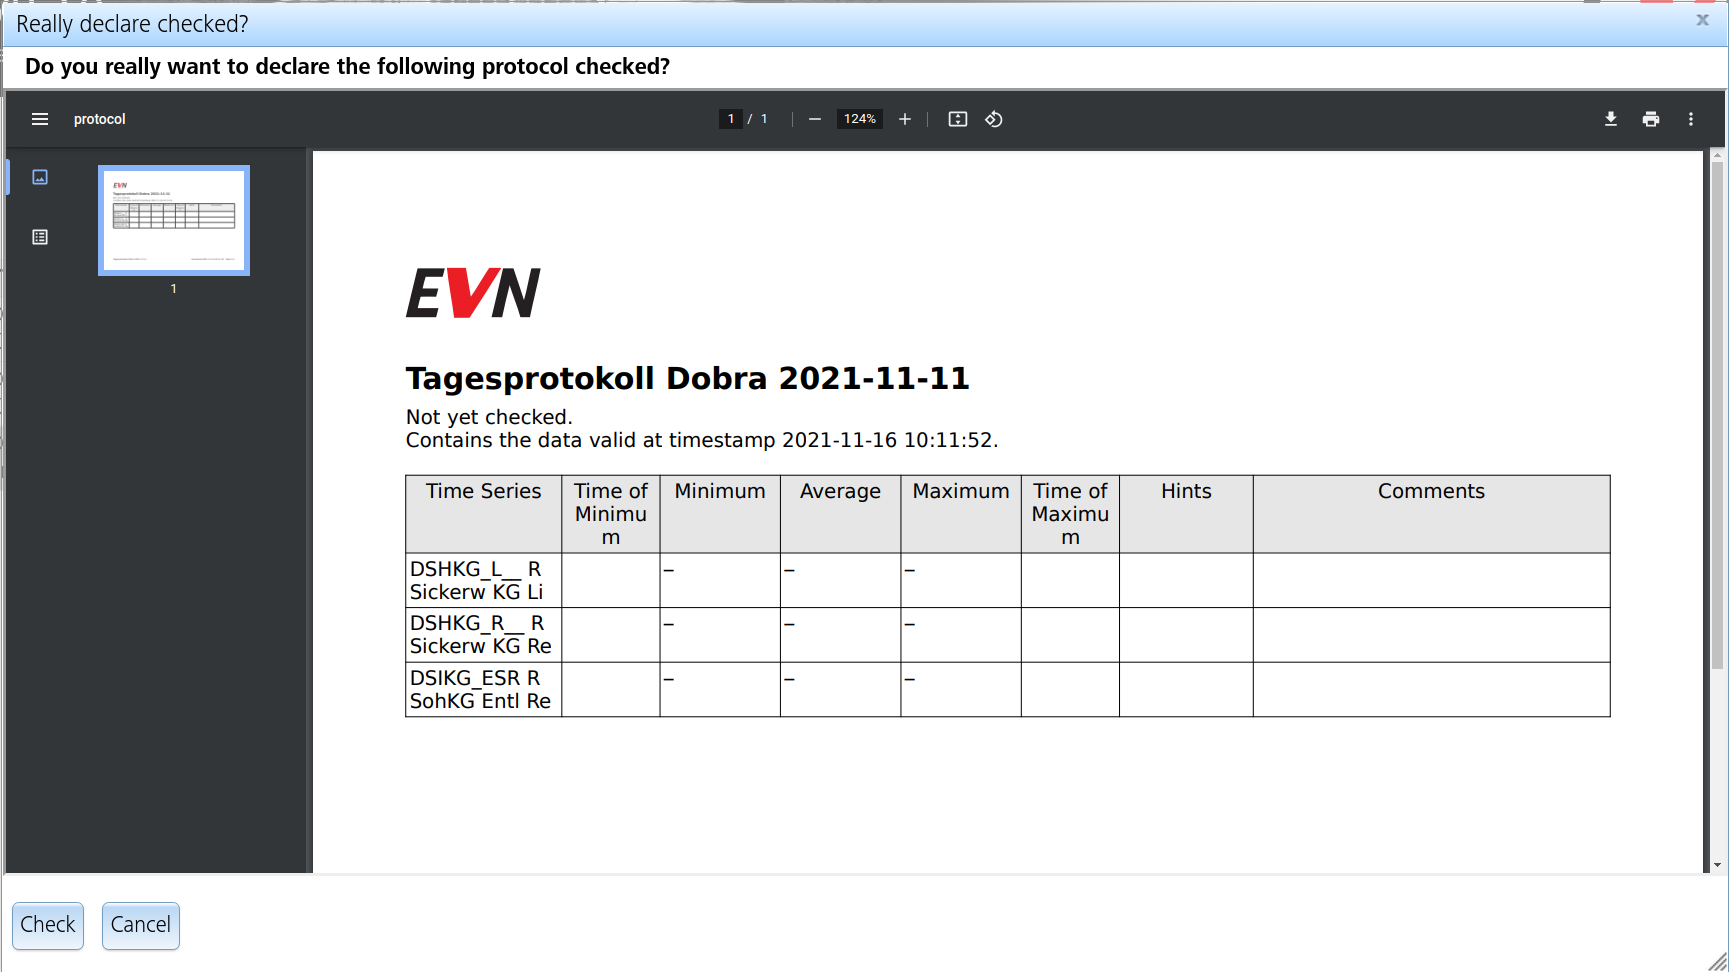
Upon clicking the "Check" button, a dialog will pop up asking you to review the protocol and giving you the choice of either marking as checked or canceling.
The protocol in the dialog will be retrieved asynchronously from the server as a PDF (the same that can be downloaded with the PDF button) and may take a few seconds to appear.
The "Check" button will only unlock as soon as the PDF is fully loaded.
After the check was accepted, the "Check" button will disappear, and the page will reflect the change (see above).