# Introduction into MDA
MDA2 is a database for hydro dam data, basically. However, it could be used for other data as well. MDA has an intrinsic tree of measure points having time series as its leaves either being imported, being calculated, being manually filled, or being entered into via HWE.
# MDA2 GUI
# Login
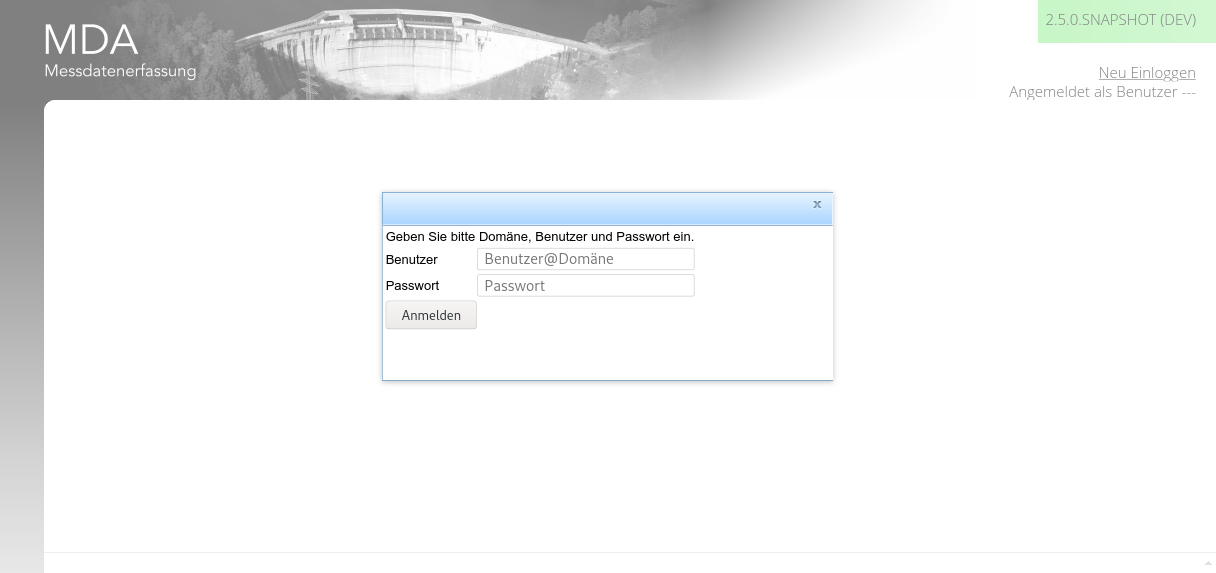
At the start of the application, you need to authenticate yourself as an authorised user. There are several implemented ways, this screen shot demonstrates the user/pass one.
# Main GUI
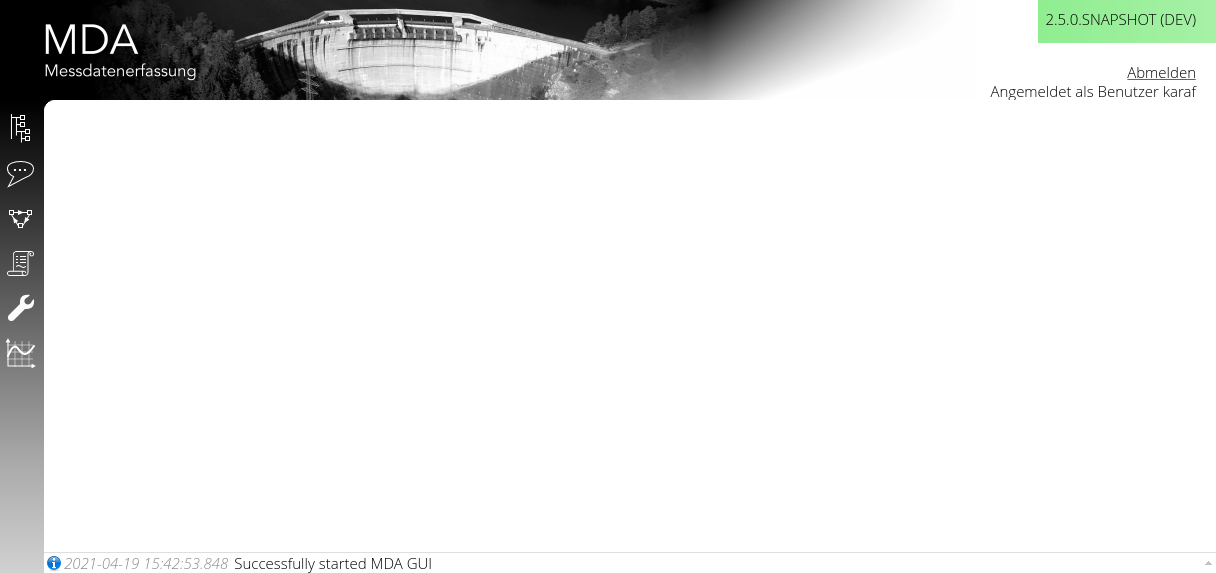
In the main window, on the top right hand side, you have:
- the version information (the color depends on the stage; production is white)
- you can log out (if the authentication method allows for that)
- you can read your login information
In the main window, on the bottom, you have:
- a log message pane where log messages (info, warn, error) are shown.
- You can click on the pane and get an history of the latest messages.
In the main menu, on the left hand side, you have:
- a menu bar for the authorised functions
# Graphs
The graphs of MDA are configured and generated in TISGraph.
Time to Value graphs utilizing many aggregating functions and configurations
- (Aggregated) Values
- Min/Max
- Min/Average/Max
- Bar
Box-Whisker graphs
Parametrized graphs are those with x and y being both time series values only ordered in time.
Georeferenced images and Geo-Graphs
# Monitoring
Aside from the server and middleware monitoring, we have added a monitoring page which you can download as JSON as well.
# Reference Clients
- TIWAG (MDA1)
- EVN (MDA2)