# Overview
# Introduction
The goal of the TISGraph application is offering the necessary tools for proper analysis and projection of time series data for the creation of reports. At the core of the application are documents which can be edited in a HTML5 GUI directly in the browser and can contain various different graphical objects for the depiction and analysis of large amounts of data. Examples for such objects are chronological and parametrical graphs, bar graphs and tables.
Elements can be positioned in the editor with millimetre precision. Documents can easily be exported into PDF files whose content matches the documents exactly, and can subsequently be printed or embedded into reports.
Documents in TISGraph are detached from the data sources used for their graphs and tables. Data is instead loaded dynamically via plugins (adapters). In order to limit access to sensitive data, TISGraph also offers user and permission management.
# TISGraph GUI
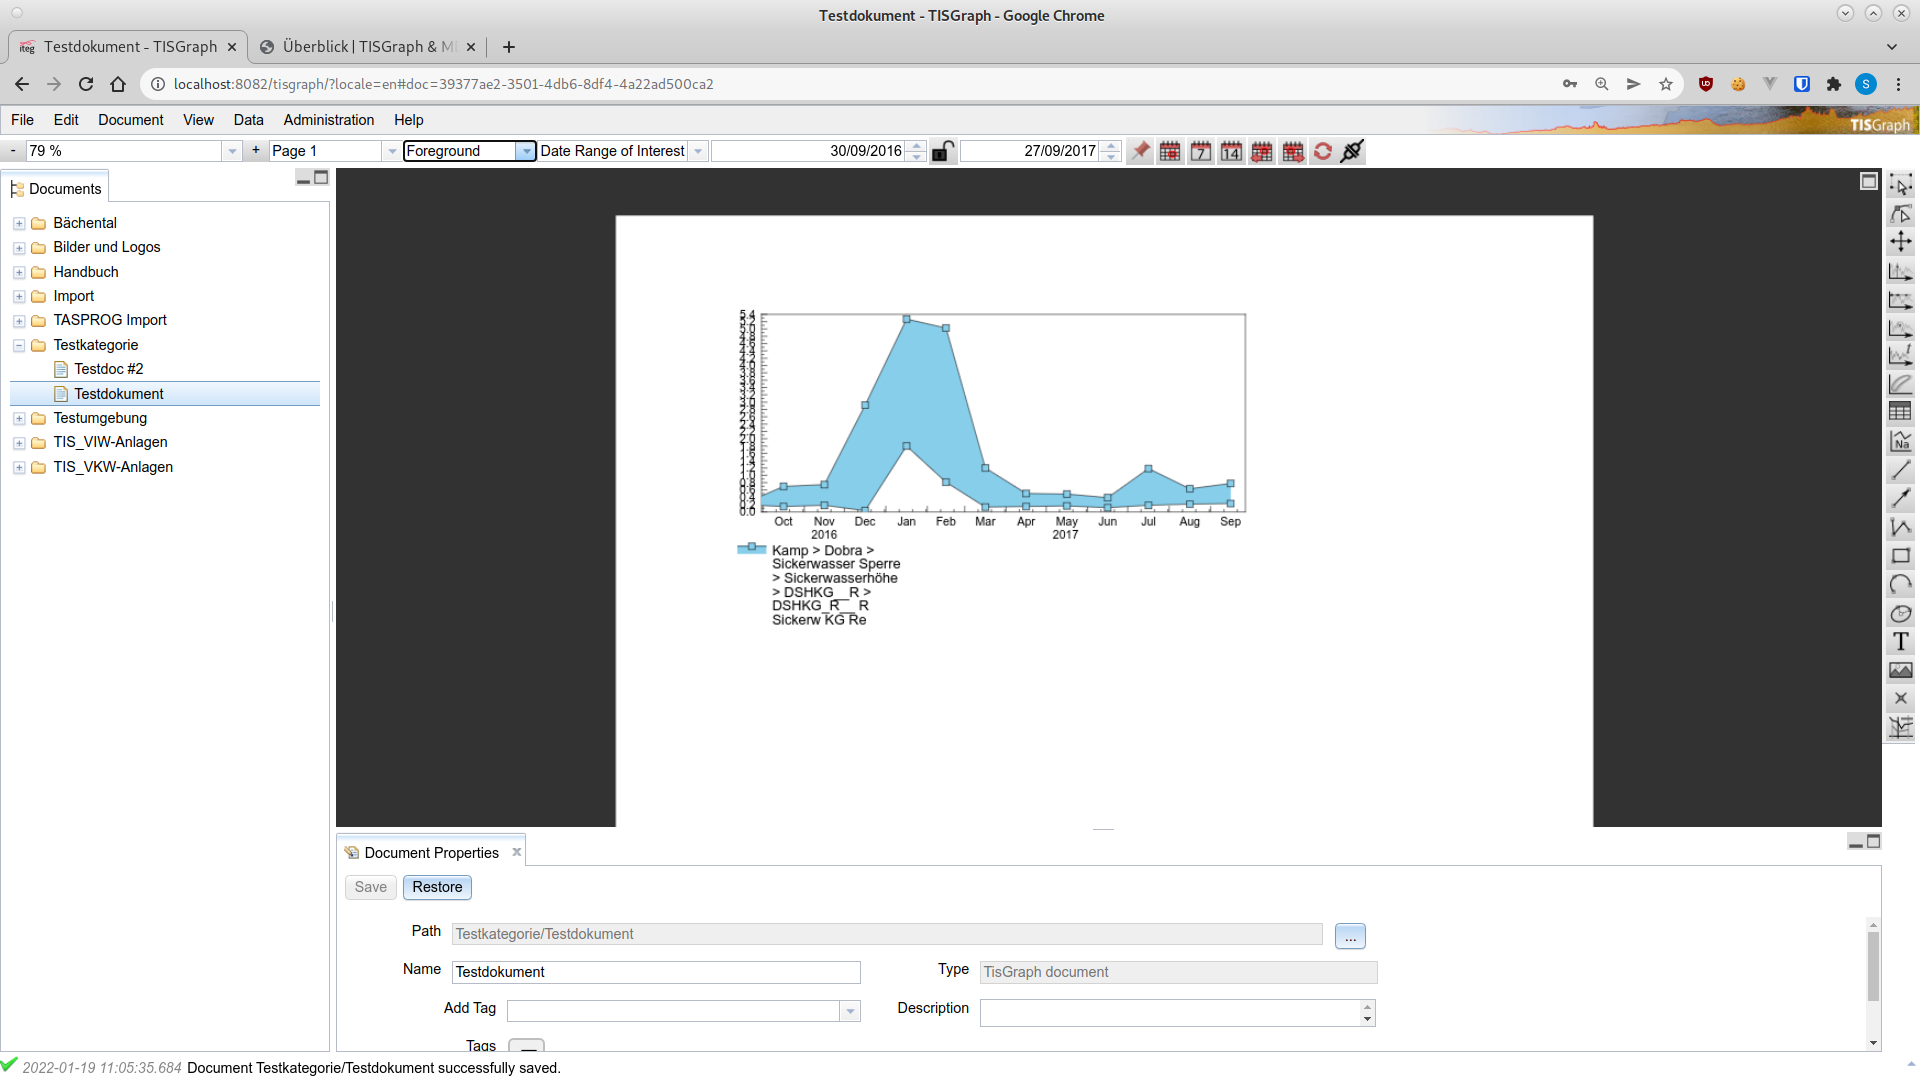
Top-to-bottom, the TISGraph GUI is comprised of the following components:
# TISGraph Document URL
All files stored in the TISGraph document database (documents and images) are assigned an unique TISGraph Document URL which can be used to access them directly, without having to search in the document tree.
# Menu Bar
Below the browser's address bar is the menu bar, coloured grey for systems in production and magenta for test systems.
# Navigation Bar
Afterwards we have the **navigation bar, which allows you to
- change the zoom level
- switch between a document's pages and layers
- adjust the current observation range
Time-based graphs, tables etc. in the document are automatically adjusted to the current observation range, if not configured for a static date range.
# Document Tree and Tag Tree
Below the navigation bar exists the module-based part of the GUI. To the left, you can find the hierarchical folder-based document tree, as well as potentially the [tag tree] which instead orders documents by their tags.
# Drawing Pane
In the center, you can find the drawing pane which is the main component of the TISGraph user interface.
# Toolbar
To the right of it exists the toolbar. Tool functionality includes
- moving document's portion/viewport which is shown on the drawing pane
- modifying objects on the drawing pane (changing size or shape, moving them, opening an edit dialog)
- creating new objects
- showing detailed information for data in the graph (e.g. single data points close to the current cursor position)
For every type of graphical objects, the toolbar contains a tool to create it. Upon importing plugins, relevant tools will also automatically be added to the toolbar without having to change the main application.
# Document Properties
Below the drawing pane you can find various configuration tabs for document properties. These include internal properties such as time zone and date format, the document's colour patterns, up to parameters for georeferencing images.
Both the left (document tree) and lower (properties section) segments can be freely enlarged, shrunken, minimized or maximized.
# Status Bar
On the very bottom, the application shows the status bar. It contains notifications regarding the program's status, such as update messages on loading data for various data sources, or saving the document.
# General Information
To close up, here are some more important information tidbits on TISGraph's functionalitx:
- all coordinates in graphical elements as well as all positioning and length parameters are formatted in [mm].
- Mandatory fields - i. e. field which require an input before the current task can be completed - are highlighted in yellow if no sufficient input exists.

- For any kind of date or numerical inputs, so-called "Spinners" are used. Values can be adjusted either by directly entering like a text field or by using the arrow buttons to the right. In the latter case, the text cursor's position in the spinner determines which value is being incremented or decremented. For instance, for the date "12/04/2020", if the text cursor is on "04", using the arrow buttons (or using the mouse wheel) will change the month value.

- TISGraph differentiates between a document's language property and its GUI language. The former is mainly relevant for formatting date-relevant text such as month annotations on time axes, the latter determines all text outside of document content (such as menu text, edit dialog text, alerts and hints etc.). By default, GUI language is set automatically to the browser's language setting, but can also be changed by setting the 'locale' URL parameter in the current installation's URL to a different supported language code:
