# Georeferenced Graphs
Georeferenced graphs can be used to draw plots on a georeferenced image. In essence, these are parametric graphs which are plotted inside a georeferenced image.
The following image shows a georeferenced graph with river bed pressure data:
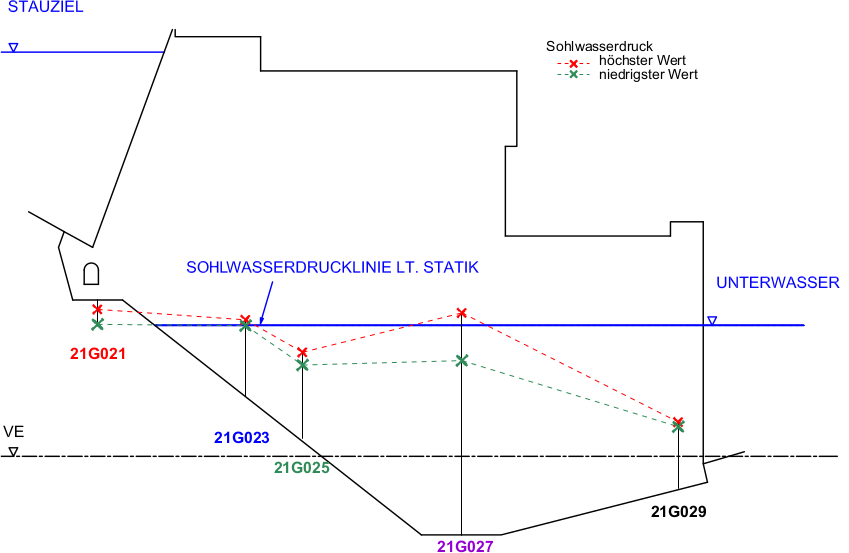
Just like regular graphs, georeferenced graphs can also contain legends. Its (georeferenced) background image can be selected in the same way as regular images. The time axis of georeferenced graphs can either use an explicit range or the document's observation range as its reference.
# Georeferencing the Background Image
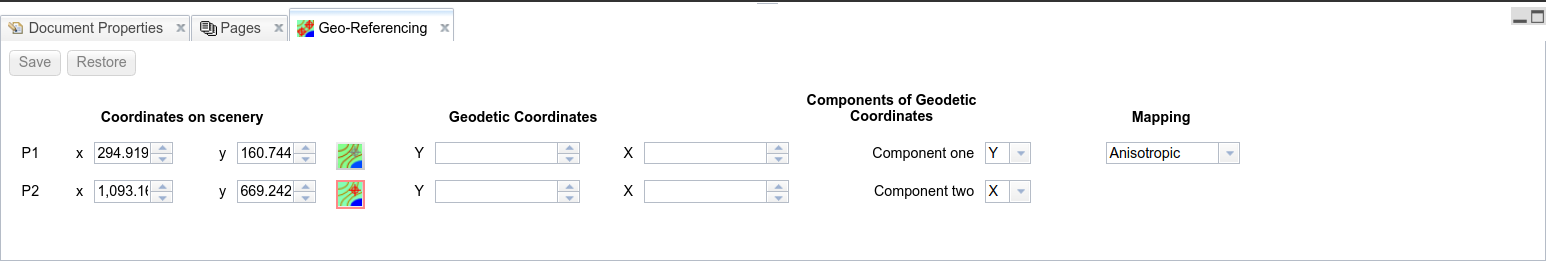
Select Anisotropic mapping type in the Georeference tab. See Georeferencing images for more info.
# Adding a Georeferenced Graph
You can insert georeferenced graphs into the drawing pane by using the associated tool(Tool: Georeferenced Graph) in the toolbar
TIP
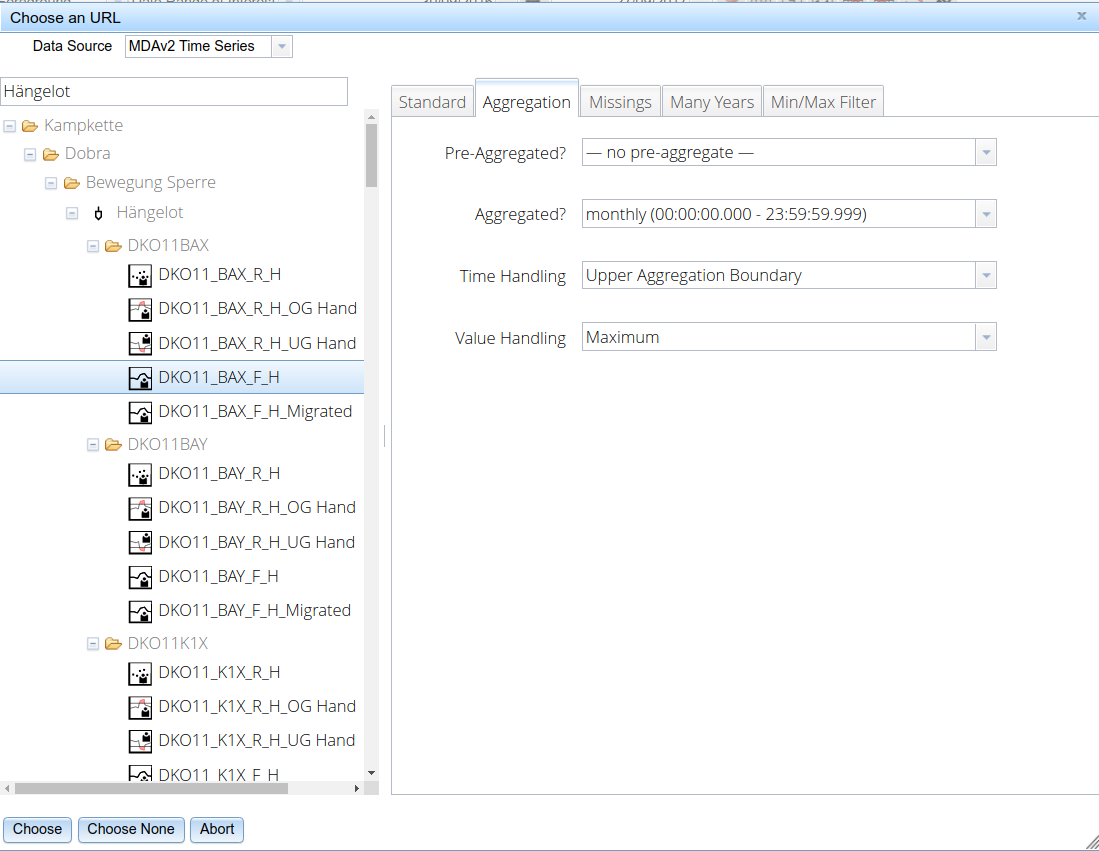
TISGraph offers functionality to combine timeseries. For instance, by selecting three different data sources to combine, the resulting combined data source contains three values for each timestamp. One use case for this are interval range graphs which require three data points for minimum, mean and maximum respectively.
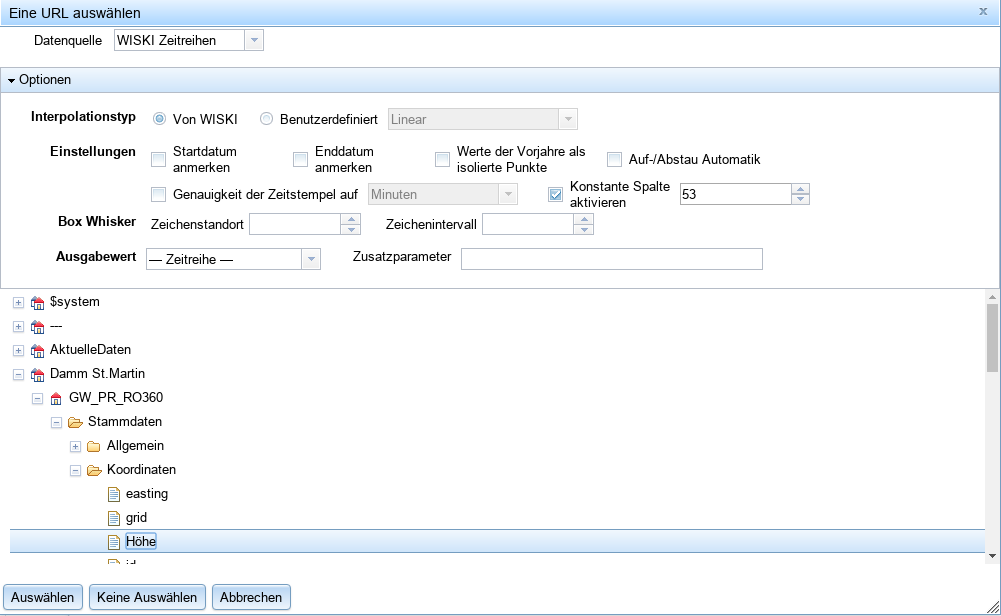
The artificial value on the horizontal axis can be imported by optionally adding a constant value on the data selector. That value will be added between the time stamp column and the data-base provided columns. See the chapter on MDA Adapter detail configuration for georeferenced graphs for more details.
TIP
Using the line rendered between points (X1,XY) and (X2,Y2), parameter Y as received from the MDA time series is being projected on its corresponding X.
For the WISKI backend, this can be adjusted if necessary.
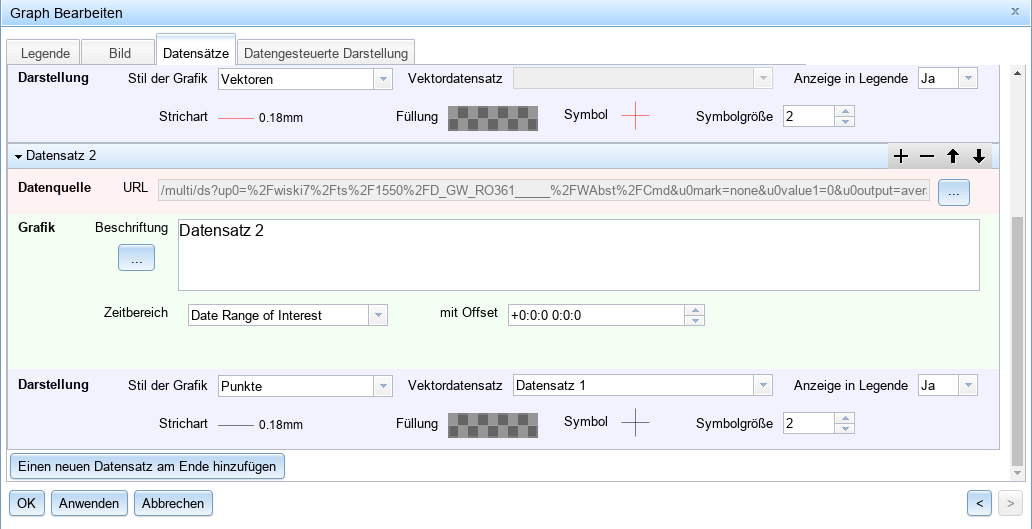
# Vector Display
To receive a similar result as in the river bed pressure graph shown above, you will need to first add a combined datasource for the data points towards the top of the graph. Secondly, you will need a dataset with graph style set to Vectors, which by itself does not plot anything, but can be added to other datasets via the Vector dataset dropdown. Doing that will place data points from the regular dataset and the vector data set next to each other, and plot a vector between every such pair according to the properties set in the vector dataset.
# Plotting on a Topological Map
X and Y coordinates of a topological map can be stored in two separate time series. One example for such coordinates are the geodesic measurements of a point shifting on a river dam. The time series containing X coordinates can then be selected as the primary data source of the map, while its counterpart can be configured as secondary. The map will bundle together coordinates sharing the same timestamps.
Should the timestamps not coincide, adjustments can be made in WISKI by applying transformations or selecting a replacement time series. In the context of MDA we recommend aggregating over an appropriate interval for the dataset, using e.g. a min/max aggregation function.