# Printing and Exporting Documents
In TISGraph, documents can be exported to PDF format, or alternatively into PNG image files. The exported PDFs confirm exactly to the drawing pane of that document. This means that adjustments down to millimetre scale are being transferred over to the PDF.
Internally, printing in TISGraph simply refers to the subsequent step of printing the exported PDF. Because of this, exporting and printing are considered the same for the rest of this manual page.
Additionally, TISGraph includes easily extensible multi print functionality. Conforming to modern standards, it is capable of exporting documents into a series of equidistant timestamps. A real-world example for this would be the segmenting of a year-long report into 12 pages each containing the respective month's data.
For the purposes of archiving or diagnosis, it is also possible to export (and import) TISGraph internal XML documents.
Images can also at any time be imported into the document database, or exported from it.
# File Formats
TISGraph can export documents in the following file formats:
- PDF files. Serial print (segmenting the PDF according to specific time intervals) is also supported
- SVG (vector graphic) files
- PNG (pixel graphic) files
- XML files, mostly for document transfer
- ZIP archive files for error scans, which include the document's XML file and potential additional files
Additionally, images of various different formates can be imported, and exported again. They can also be used for geo referencing.
For the rest of this manual page, we will differentiate between:
- TISGraph documents, internal files which can contain objects such as graphs, text or images
- Images, i.e. singular image files imported into the DB which can be embedded into documents
# Export
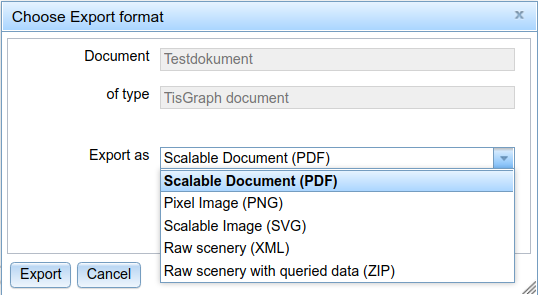
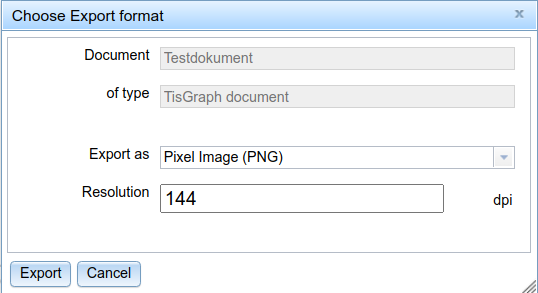
Exporting of TISGraph documents is available under the menu point File → Export. You are prompted to choose between exporting into a vector graphic (PDF), a pixel-based image (PNG) with the selected resolution, a scalable image (SVG), a XML file for importing into another (or the same) TISGraph instance, and a ZIP file which contains both the document XML and all image files embedded in it. Non-document files such as images can only be exported in the exact same state as they were imported in.
Printing TISGraph documents can be done under the menu point File → Print. As mentioned above, printing is equivalent to first exporting to PDF and then printing the result. After rendering has been completed on behalf of the server, the browser will try to open a popup for printing (potentially this needs to be allowed in browser settings first, see the browser's manual for more help). If working correctly, a print prompt should pop up afterwards.
Printing always takes the document in its current state in the drawing pane as the input, even if there are unsaved changes.
# Multi Print
The range of data shown in TISGraph graphs, tables and other data containers is typically determined by the current observation range. It might for instance be set to "01/01/2014 - 01/02/2014" (in DD/MM/YYYY format) to show data for the month of January 2014. In order to print multiple months (or other such time units), multi print functionality may be used. It can be found under the menu point File → Multi Print, which will open the following dialog:
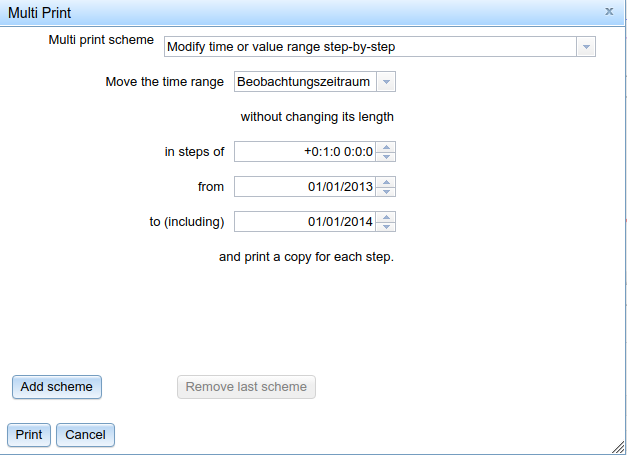
You can select one of the configured observation ranges to multi-print, alongside specifying the duration of the interval (step) to be compiled into PDF pages. The time format of the duration input field is Year:Month:Day Hour:Minute:Second.
In the above example, confirming these settings will generate and subsequently try to print an ordered 12-page PDF, each representing a month in the year 2013. This is because the time range set in the "in steps of" input field is set to 1 month.
To be more precise, the dialog first changes the document's observation range end timestamp to its start timestamp plus the declared "step" duration and parses that into a PDF page. It then repeats this process for the following time steps until the newly set end timestamp would be outside of the original observation range. Mind that settings made in the multi print dialog do not modify the document's observation range.
To illustrate, in the provided example:
- Start with the interval 01/01/2013 - 01/02/2013, the observation range's beginning timestamp until one month (specified step size) later
- add the exported PDF page of that month to the final PDF
- advance to the next observation range of 01/02/2013 - 01/03/2013
- keep repeating for the entire year of 2013
- at some point step duration becomes 01/12/2013 - 01/01/2014
- After exporting the month of December 2013, the print is cancelled because the new end point of the next step's observation range would be 01/02/2014, which lies outside of the selected original observation range in the dialog (01/01/2014).
- The result is a 12 page PDF with pages 1-12 corresponding to months January - December of 2013.