# Tools
While in write mode, the toolbar is found to the right of the drawing pane. In read-only mode, the toolbar is hidden, with only the pan tool being permanently active.
Using the mouse wheel, the zoom level of the current document can be changed independently to the currently active tool.
TIP
You can cancel usage of the current tool at any time using the Escape button and return to default mode.
# Editing Tools
Multiple elements can be selected concurrently on the drawing pane. Selection can only performed if any of the selection tools are currently active.
- Left clicking without holding CTRL on an object will select only that object, deselecting all previously selected elements.
- Left clicking while holding CTRL on an object will add that object to the current (multi-)select.
- Left clicking while holding both CTRL and SHIFT will remove an object from the current multi-select, in case something was accidentally selected.
Left clicking without holding CTRL on an empty space in the drawing pane will empty the current selection.
Depending on which selection toll is active in the tool bar, selection will be represented differently in the drawing pane. The Default selection toolrepresents selection with a black border and mark, while the point select tool shows a much lighter border while pointing out object vertices. However, the current selection does not change by selecting a different selection tool.
The following selection tools are available:
- Selection Tool (Standard):
 ) Selects single objects with a left click. Holding left click and dragging the black handles shown after selection allows for scaling of objects. Double clicking on an object while the tool is active will open the edit dialog.
- Point Selection:
 Allows manipulation of a single object's points (vertices), e.g. to change the shape of a polygon. Each vertex will be highlighted by a rhombus. Multi-select is not possible with this tool. As with the standard tool, double clicking an object will open its edit dialog.
- Pan:
 Allows moving the viewport by left click dragging. Equivalent to dragging with the mouse wheel pressed.
# Geometric graphical elements
TISGraph supports the following graphical objects which don't contain any data, but can instead be used to illustrate and organize documents.
Line:
 Creates a straight line between two points by clicking on two points in the drawing pane. First click places the start point, second click the end point.
Arrow:
 Creates a straight line between two points along with a customisable arrowhead at the end point. Stroke and arrow templates can be chosen in the edit dialog. Placing arrows follows the same logic as lines.
Rectangle:
 Click twice in the pane to the define the two opposite corners of the new rectangle.
Circular Arc:
 A circular arc is defined by three points, which are determined by three subsequent clicks on the pane. A circular pane can define both borders and fill properties, the latter of which will place a straight line between the two corner points.
Ellipsis:
 ellipses are defined by a center point and two radiuses. The first click defines the center, second and third clicks the endpoints of their corresponding radiuses.
Polyline:
 A polyline consists of one or more line segments and can either be open or closed. Double clicking on a vertex will complete the drawing process.
All graphical objects have access to the same color and line templates.
# Embed images
 Graphical elements be taken from either the TISGraph document tree, from MDA or from an external web URL. Possible use cases might be logos or dam profiles. As described in the Georeferencing images section, images stored in the document database can also be georeferenced, i.e. assigned an (an)isotropic mapping of drawn coordinates to geodesic coordinates.
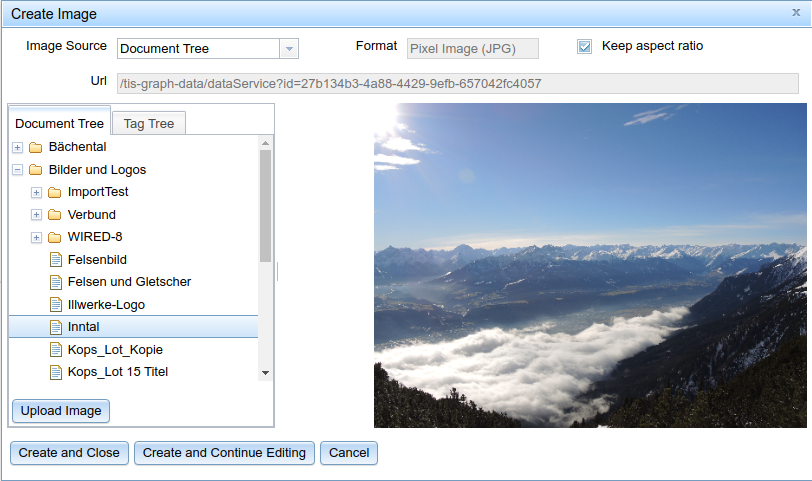
TISGraph import functionality supports most of common pixel graphic formats (PNG, JPEG, GIF, TIFF) as well as vector graphics in the form of a one-page PDF file.
By adding the relevant plugins, additional image sources can be added for image importing. One such plugin, for instance, allows the importing of HPGL graphics.
# Text fields
 Text elements are added at the specified anchor. A variety of color and formatting options is supported, as well as text angling. Text objects can also contain dynamic content such as date ranges.
TIP
You can also use placeholders for text.
# Point Marker
 Simple symbols for marking positions within the document. You can choose between a few different symbols, such as plus, cross, circle, triangle and star.
TIP
# Graphs


TIP
Information for generic graphic creation can be found in the chapter for graphics
You can also add annotations to graphs
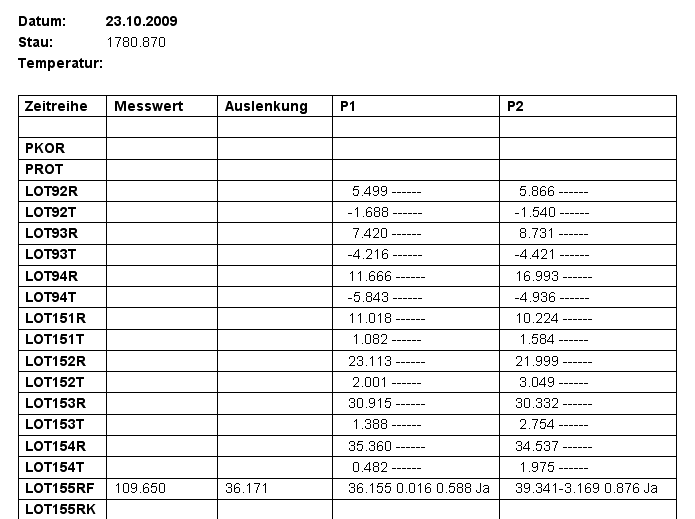
# Tables

A data table can be used for the depiction of measurements and reference data of one or more time series in table form, as can be seen in the below image.
If multiple time series are fused into a table, every row corresponds to a time stamp to be applied to all data sources.
# Data Evaluation
- Vertical evaluation of data points:
 Shows all values on the selected vertical axis. Both axes show both exact and interpolated (marked with a dot) values.
 - Horizontal evaluation of data points:
 Shows all values of the selected horizontal axis. Both axes show both exact and interpolated (marked with a dot) values.
 - Single evaluation of data points:
 Shows all values which were selected with the catch radius. Values of both axes are being shown as interpolated values.