# Document Properties
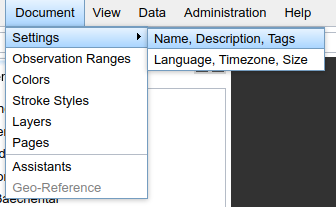
Document properties can be retrieved via the different entries in the Document menu point and are shown below the drawing pane. Document properties include:
- General properties (name, description, tags)
- Document internal settings (language, time zone, paper format)
- Observation Ranges
- Colors
- Stroke Styles
- Layers
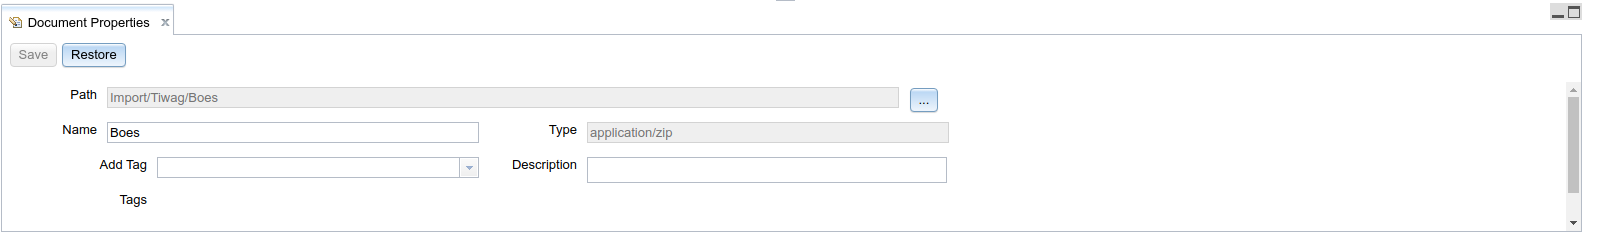
# Document Properties
In this pane, you can change name, description and tags of a document. If a new document is being created, both Document Properties and Document internal settings tabs are being opened.
# Document Internal Settings
In this tab, you can set the document's language, time and paper format/dimensions.
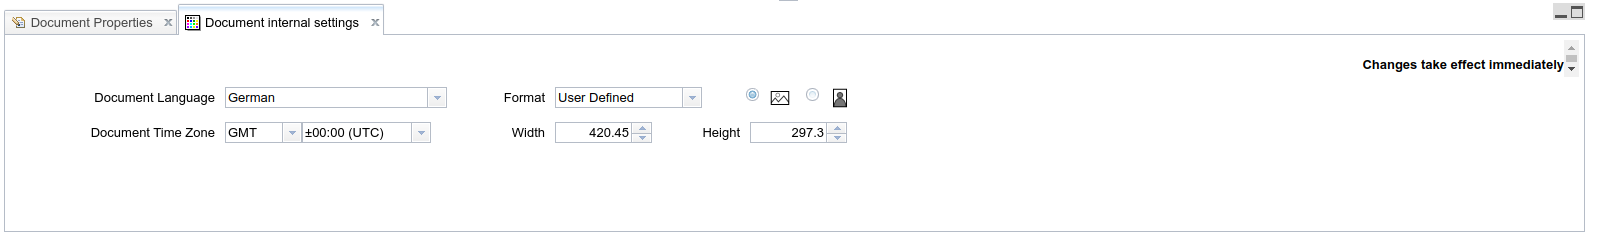
A document's time zone determines the default date format used for e.g. axes, data sets and observation ranges. Data objects such as graphs can overwrite this setting in their edit dialogs:

It is worth mentioning that all timestamps delivered by TISGraph data sources are UTC timestamps (measured in seconds after 1/1/1970) and as such are not attached to time zones. This means that TISGraph handles the proper calibration of these timestamps to the appropriate time zone when using them within data objects. Because of this, every object with timestamps requires a time zone configuration to do so properly.
Document size can be chosen freely. Users can either explicitly enter a specific width and height (in print millimetres) or choose from one of the commonly used pre-defined formats. If doing the latter, document alignment (portrait or landscape) can also be chosen.
# Observation Ranges
In real-world examples it is common that a document contains a multitude of graphical elements which all relate to the same date range. For this use case, TISGraph supports the concept of observation ranges, which each consist of both a time interval and a time zone. For instance, by changing the observation range to 01/01/2012 - 01/01/2013 in the navigation bar, all graphs in the currently opened document will show data for the year 2013.
TISGraph data sources X axis values can either be a UTC timestamp or a numeric value. The former is usually more common, containing a value representing seconds since 01/01/1970, such as 1413467917 (which is the 16th of October 2014, 13:58:37). Date ranges always use such timestamps as their start and end point. Due to the above mentioned number representing a timestamp, a time zone is also needed in order to properly interpret it as the correct date, such as 15:58:37 for the MESZ (+2) timezone.
In the case of the X value being a numeric value unrelated to timestamps, no further evaluation is being performed and the value is applied to the axis as-is. In this case, a value range is required in order to properly space data points along the X axis.
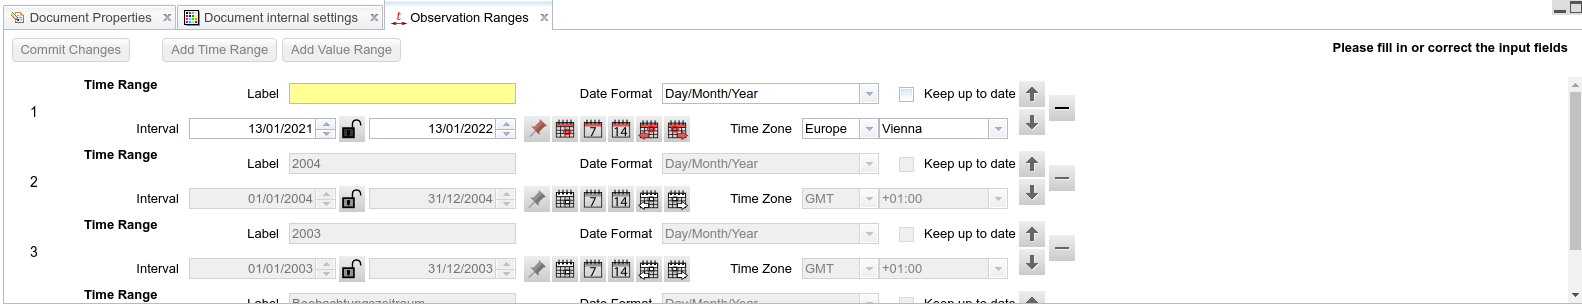
In most cases, from an user standpoint, it is sufficient to simply interpret the X axis as timestamps and set the time zone. Should further configuration be required, however, it can be found under Document → Observation Ranges in the form of the following dialog:
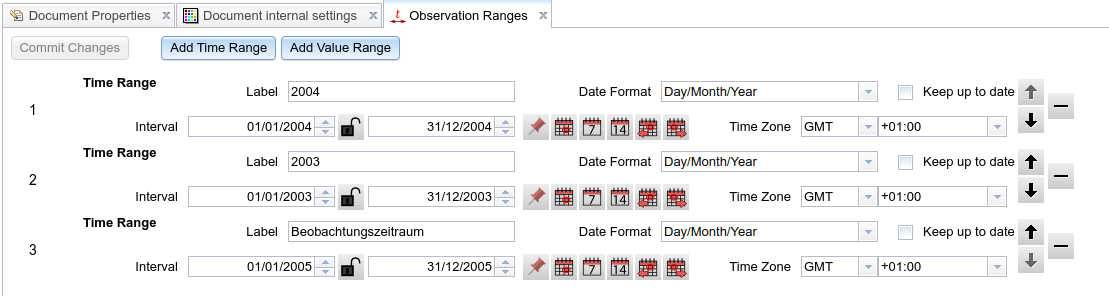
The control elements in the lower left corner of a time range ("Interval" and all buttons to the right of it) have the exact same functionality as their counterparts in the navigation bar above.
Clicking on "Add Time Range" will add a new time range to the top of the list:
The creation of a new time range, unlike modification of existing ones, must be confirmed via the "Commit Changes" button, after all necessary fields have been entered. Until the newly created range is fully configured, the already existing ones cannot be modified anymore. In the screenshot above, the yellow background signifies that the "Label" field still needs a value.
# Pages and Layers
TISGraph documents can contain a freely choosable amount of pages and layers. In the print command, pages are printed according to their order. The currently displayed page as well as its active layer can be changed in the navigation bar.
If objects such as graphs are added to the drawing pane, they are implicitly assigned to the currently active layer. Layers can be part of more than one page, meaning the same object can also be part of multiple pages. Typically a background layer is used for generic objects such as logos, section headers, a border around the drawn area etc. The information itself is typically embedded into one or more foreground layers. Following that, it is of course also possible to add a graph which should be visible on every page to the background layer.
Pages and Layers can be configured via their corresponding menu points in the Document Menu. Document → Pages opens the following dialog:
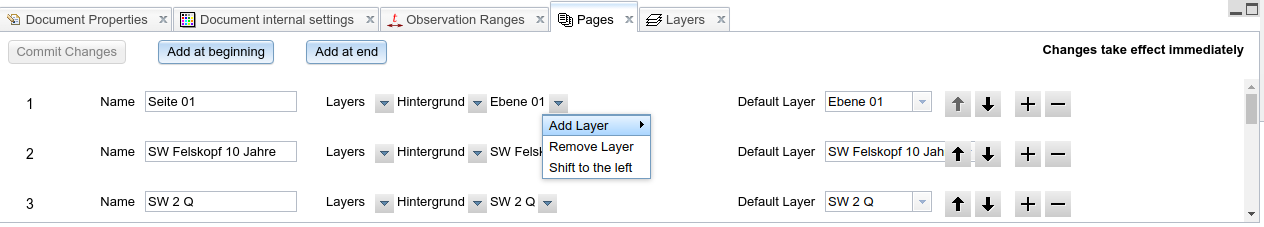
Using the appropriate buttons, new pages can be created while existing pages may be deleted or their order rearranged. The order of a document's pages corresponds to the order in which they are listed in the relevant navigation bar drop down element. Please not that changes made in this tab are being applied with immediate effect (note the hint in the top right corner of the previous screenshot)
The leftmost listed layer is the one drawn furthest to the back, while the ones to the right of it are drawn on on top of their left neighbour. Using the dropdown shown in the above screenshot, layers can be assigned or removed from each page, as well as their order adjusted. Please note that using this menu the layers themselves are not modified, only (un-)assigned to the pages. Changes to layer assignment also take effect immediately.
In order to manage the layers themselves, open the following tab in the menu via Document → Layers:
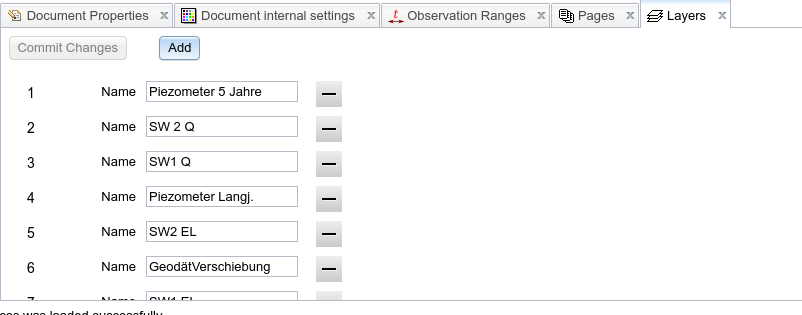
While layers are ordered within the context of a page, they are not ordered on the document level. Which is why, unlike the pages tab, the layers tab does not include buttons for rearranging its elements.
# Colors and Stroke Styles
Colors and Strike styles in TISGraph are organized in palettes. Lists of colors and stroke styles used in the documents can be found in the menu under Document.
When creating or editing graphic objects, these colors and stroke styles are available to the user via the respective drop downs. New colors and stroke styles can be added to the palette directly in the various dialog, without having to make a detour to the menu.
Lists of all colors and stroke styles available in the current document can be viewed and changed under Document → Colors and Document → Stroke Styles respectively. As with pages and layers, configuration dialogs are opened below the drawing pane.
# Colors
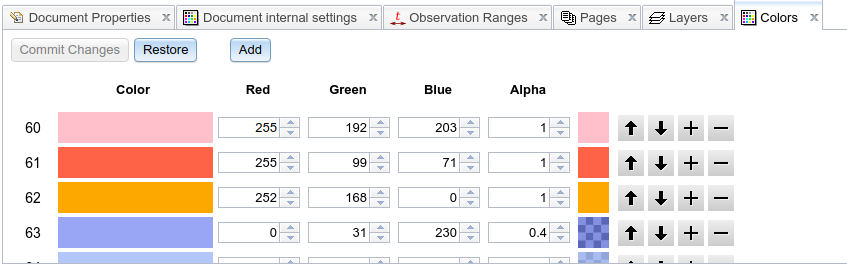
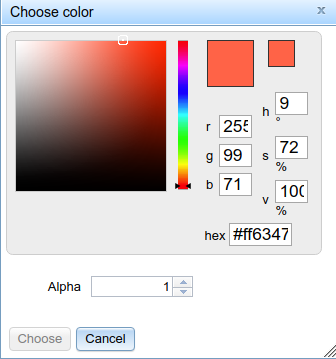
In the main dialog, you can directly change the RGBA values of this document's colors. The order in which they are listed in this dialog is the same as the palette shown in any of the edit dialogs. You can also open a color picker by single clicking on the colors itself:
# Stroke Styles
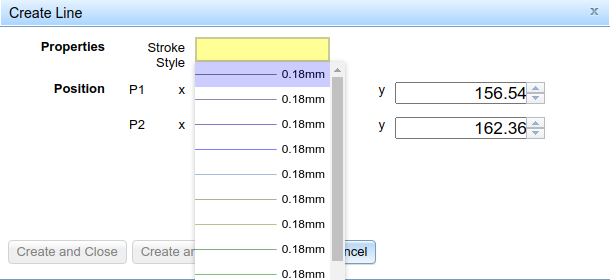
After selecting the option in the menu, the following dialog for creating, deleting and editing stroke styles will open:
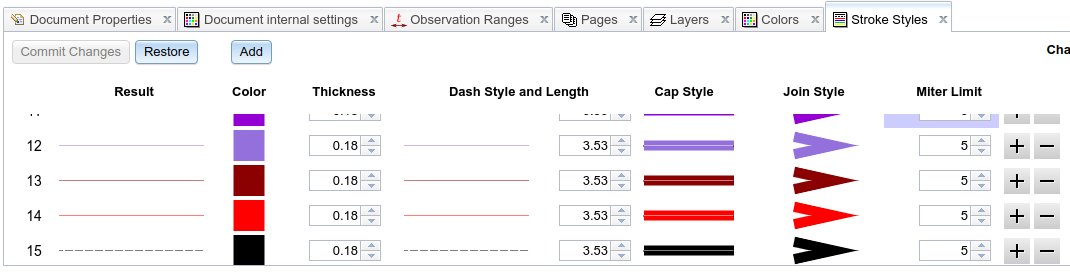
The stroke styles in this tab are the same as the ones found in any edit dialog involving lines (e.g. graphs or polyline), including order. Configuration options for each individual style include:
- Color, clicking the color square opens the color palette mentioned above
- Thickness (of the line) in millimetres
- Dash style in case of a dotted or dashed line. Length refers to the length of one "unit" of the dash style, and is meaningless for uninterrupted lines.
- Cap Style refers to the manner(rounded, cornered) in which lines are capped off:

- Join style refers to the manner in which two differed lines are joined together. Options include rounded, blunted, and pointed:

- Miter Limit lets you more accurately define exactly how pointy the join style is supposed to be if the third option above is being used, with the default value of 5(and above) meaning no denting at all.
It should be noted that the last three options above are significant only for lines of at least 0.5 thickness, as the difference is barely noticeable below that.