# Projection of Chemical Evaluations
TIP
Currently, this functionality is built into the WISKI backend. Support for MDA can be implemented on demand.
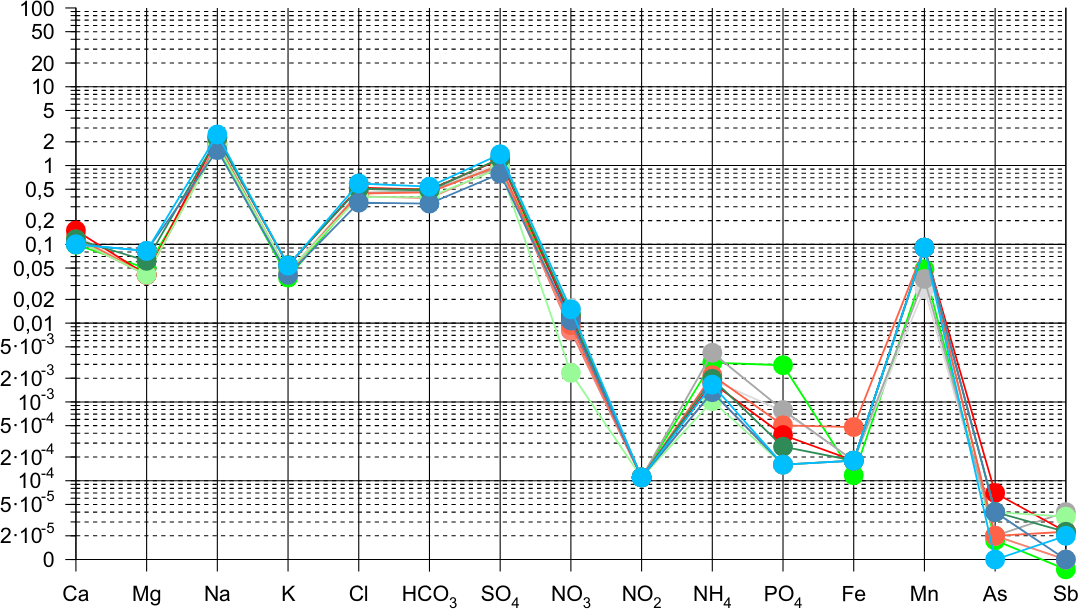
# Schöller Graph
Schöller graphs show equivalent concentrations of (drinking) water probes. For this graph, the abscissa shows different kinds of ions (like Ca, Mg, Na, K, Cl, HCO₃, SO4, NO₃, NO₂, NH₄, PO₄, Fe, Mn, As, Sb) while the logarithmic ordinate shows the corresponding equivalent concentrations
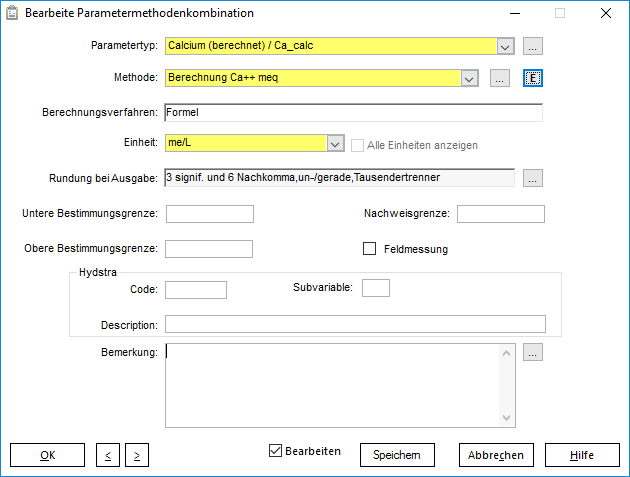
# WISKI WQM
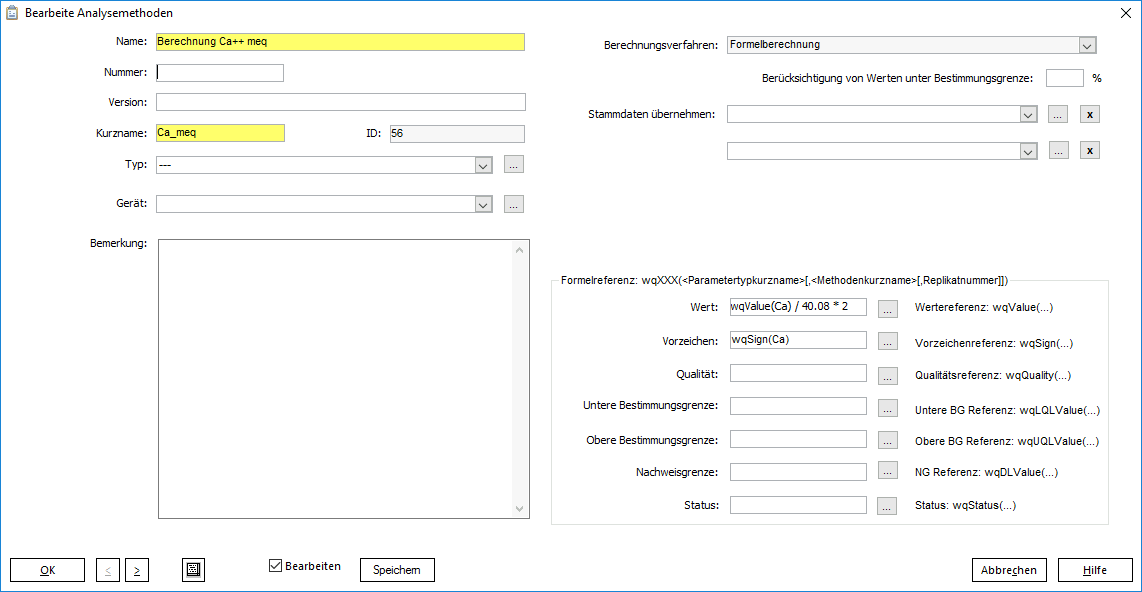
TISGraph receives its equivalent concentration(short: EC) data from WISKI's WQM ("Wasserqualitätsmodul" - water quality module). This module applies WQM analysis formulas to existing WQM data. The following example shows the calculation of Ca EC:
# Creating a Schöller Graph in TISGraph
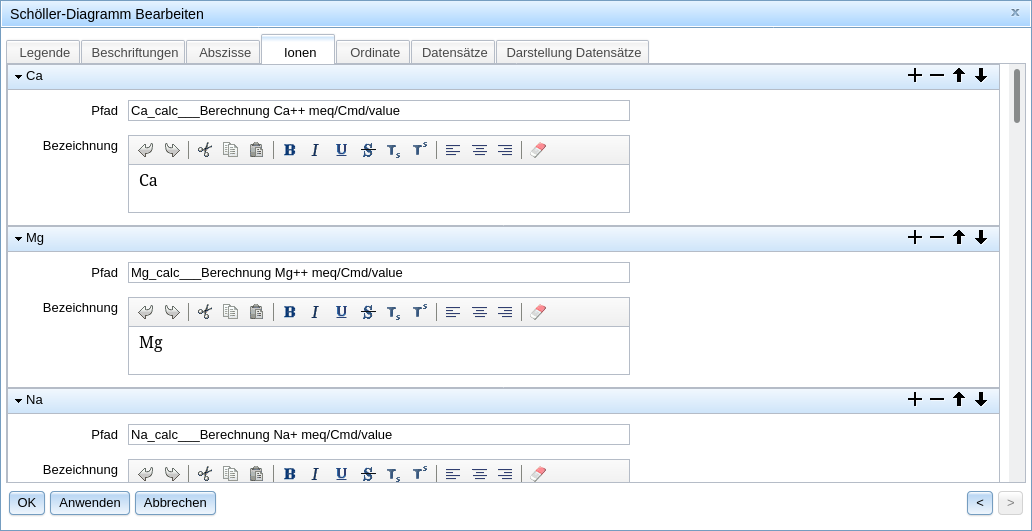
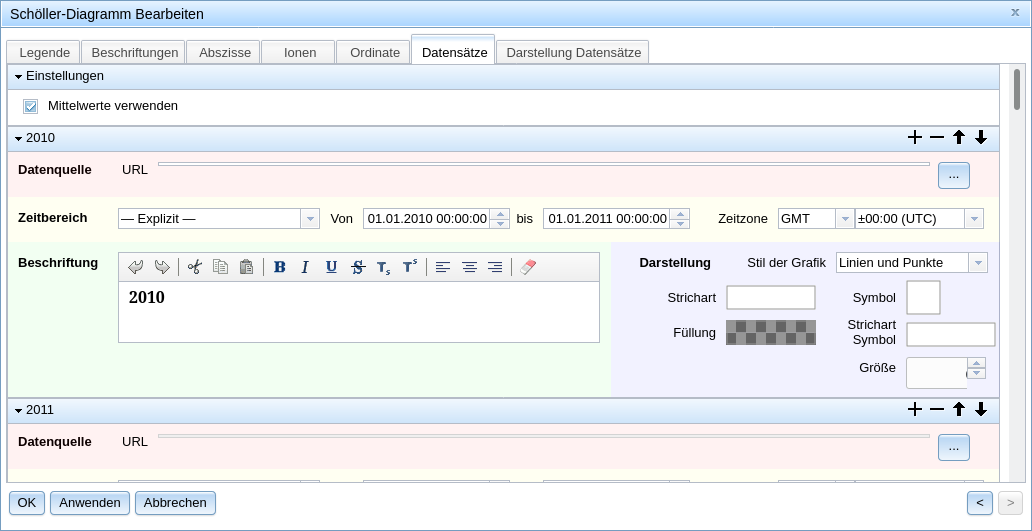
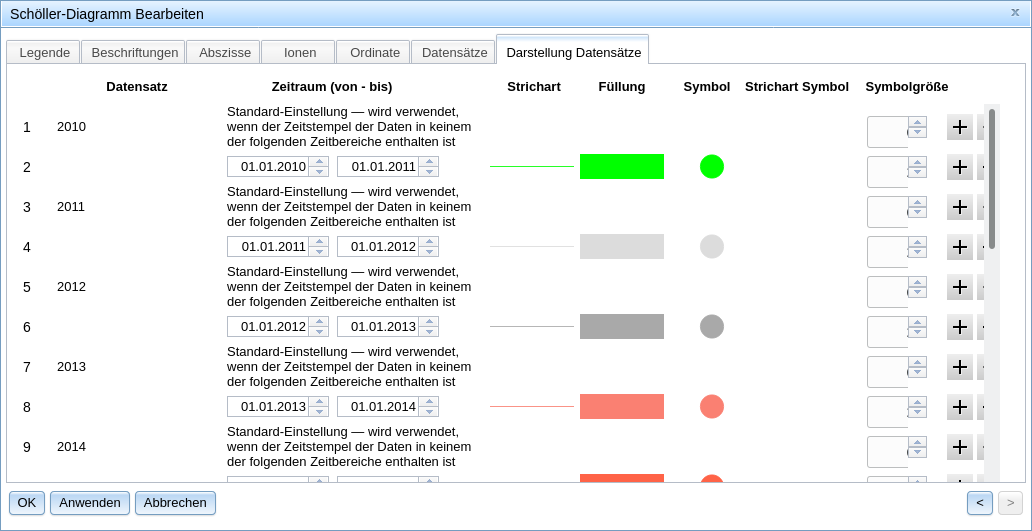
You can create new Schöller graphs within TISGraph documents by using the corresponding icon( ) in the toolbar. Inside the dialog, you can then select the to-be-depicted ions as parameter combinations (e.g. "Ca_calc___Calculation Ca++ meq/Cmd/value"), as well as the WQM station to draw data from:
# Piper Graph
Piper Graphs show relations between ECs in (drinking) water probes by combining three different shapes. The result of a sampling is depicted as a point in each of the cation triangle (Ca/Mg/Na+K), the anion triangle (SO₄+NO₃/Cl/HCO₃) and the parallelogram.
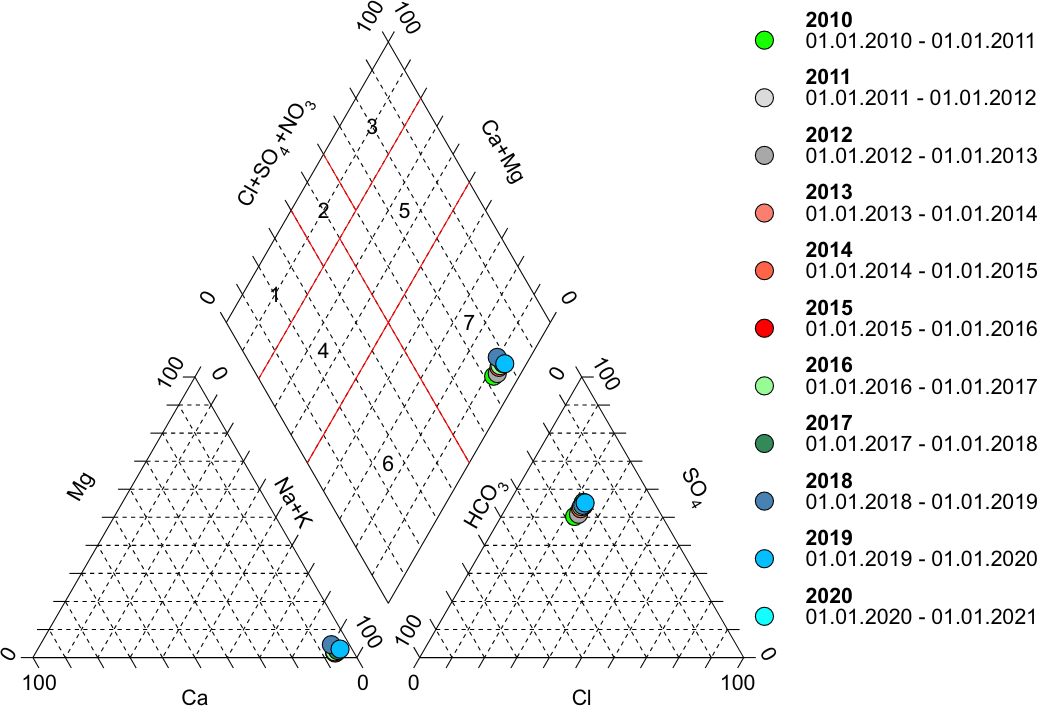
Just like Schöller Graphs, Piper Graphs draw their data from the WISKI-WQM.
# Creating a Piper Graph in TISGraph
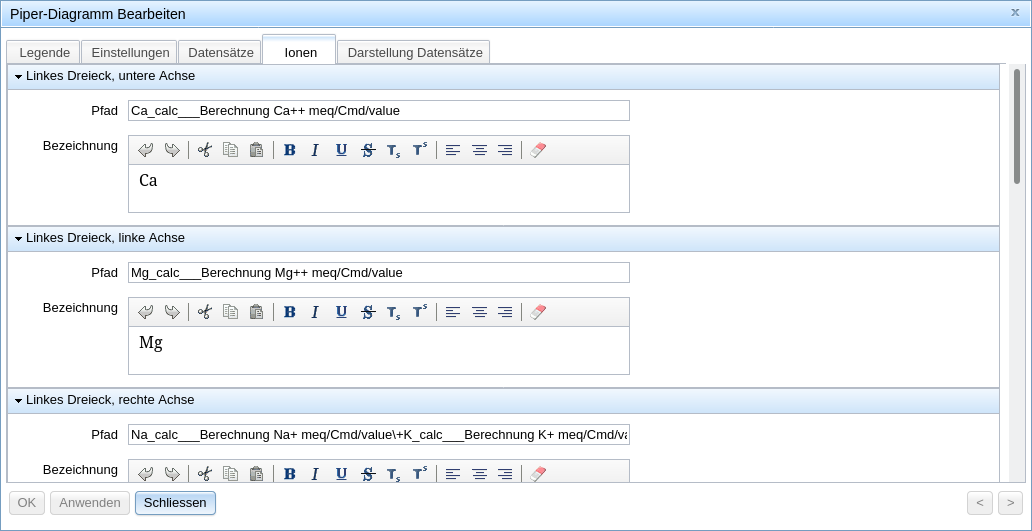
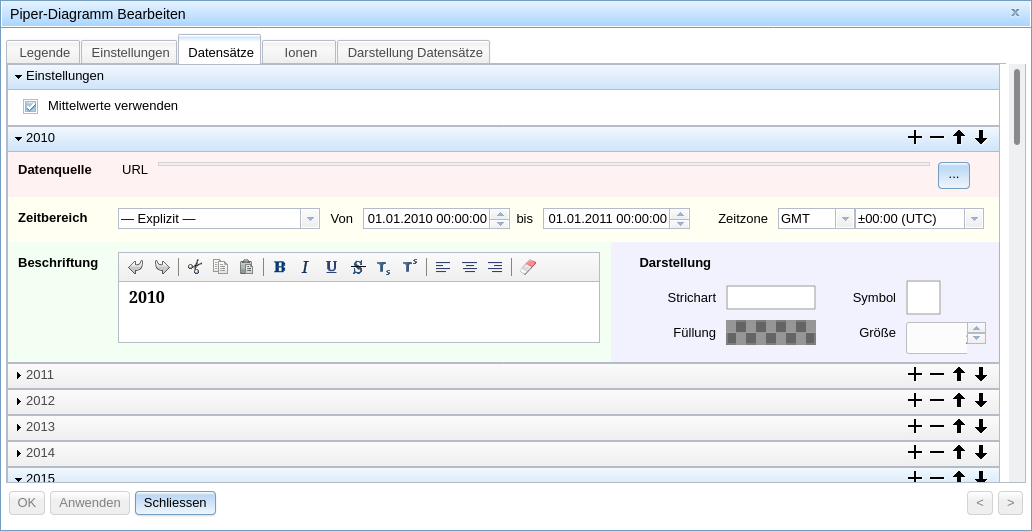
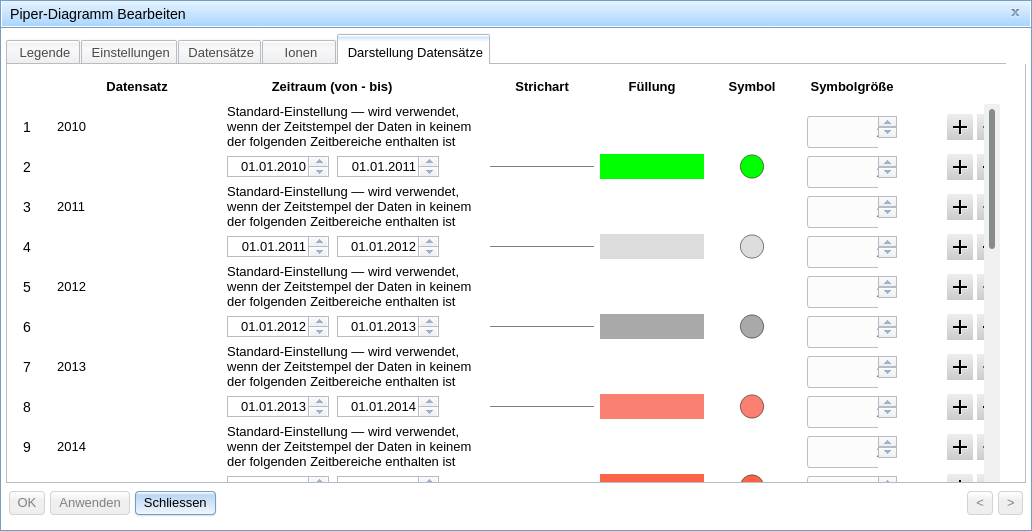
You can create new Piper graphs within TISGraph documents by using the corresponding icon( ) in the toolbar. Inside the dialog, you can then select the to-be-depicted ions as parameter combinations (e.g. "Ca_calc___Calculation Ca++ meq/Cmd/value"), as well as the WQM station to draw data from:
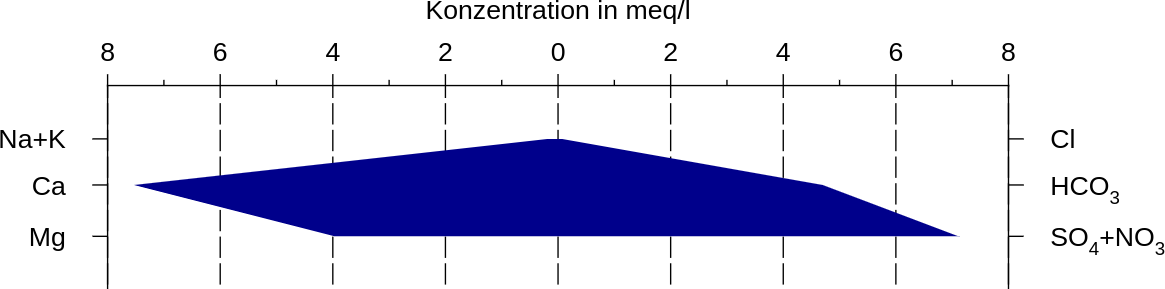
# Stiff Graph
A Stiff Graph represents the ECs of individual samples as shapes. The negative part of the abscissa represents cations, while the positive part represents anions.
More information about the sourcing of data can be found in the WISKI-WQM section.
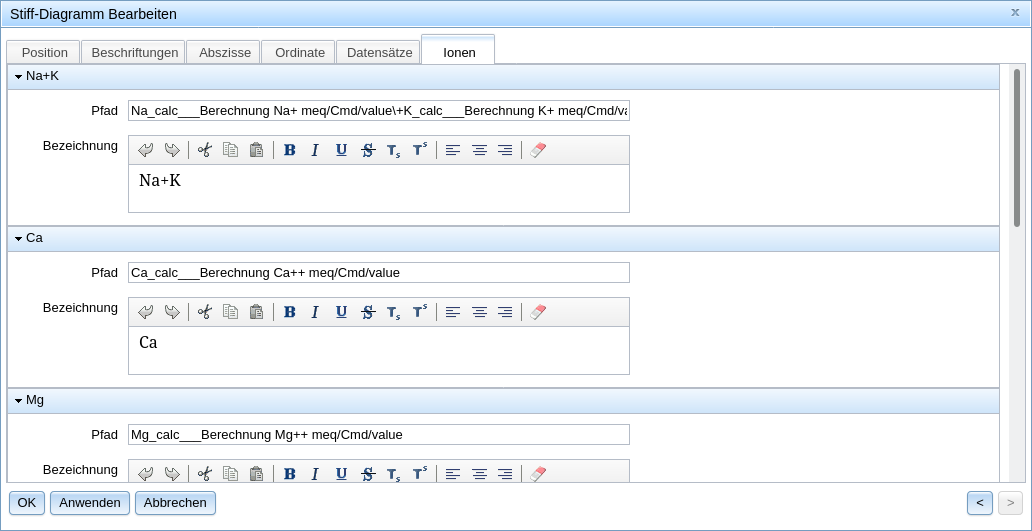
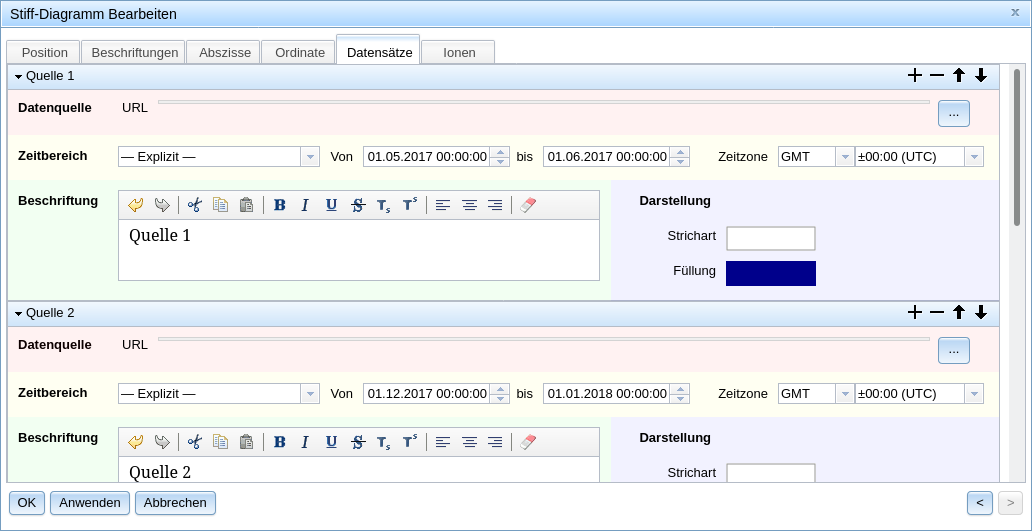
# Creating a Stiff Graph in TISGraph
You can create new Piper graphs within TISGraph documents by using the corresponding icon( ) in the toolbar. Inside the dialog, you can then select the to-be-depicted ions as parameter combinations (e.g. "Ca_calc___Calculation Ca++ meq/Cmd/value"), as well as the WQM station to draw data from: